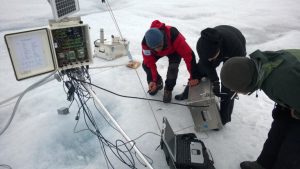
Researchers service one of PROMICE’s automatic weather stations on the Greenland ice sheet that was used in the study. Credit: Photo by William Colgan, York University
A new study by researchers from Denmark and Canada’s York University, published in Geophysical Research Letters, has found that the climate models commonly used to simulate melting of the Greenland ice sheet tend to underestimate the impact of exceptionally warm weather episodes on the ice sheet.
The study investigated the causes of ice melt during two exceptional melt episodes in 2012, which occurred from July 8 to 11 and from July 27 to 28. During these exceptional melt episodes, which can be regarded as an analogue to future climate, unusually warm and moist air was transported onto the ice sheet. During one episode, the researchers measured the ice sheet melting at more than 28 cm per day, the largest daily melt rate ever documented on the ice sheet. While the two brief melt episodes only lasted six days combined, or six per cent of the melt season, they contributed to 14 per cent of the total melt.
Using the Programme for Monitoring of the Greenland Ice Sheet (PROMICE) automatic weather station data, the researchers ranked the energy sources contributing to surface melt during 2012 at twelve PROMICE sites around the ice sheet periphery. While ice sheet melt is usually dominated by the radiant energy associated with sunlight, the researchers found that the energy associated with air temperature and moisture content, rather than radiant energy, was responsible for more melt during the 2012 exceptional melt episodes.
As Robert Fausto of the Geological Survey of Denmark and Greenland, lead author of the study, says, “When we were analysing our weather station data, we were quite surprised, that the exceptional melt rates we observed were primarily caused by warm and moist air, because ice sheet wide melt is usually dominated by radiant energy from sunlight. ”
This finding has implications for how the scientific community projects future ice sheet melt using climate models. In the study, the researchers also show that while the models presently used to project ice sheet melt can accurately simulate melt due to radiant energy, models tend to systematically underestimate melt due to the non-radiant energy processes they document.
“Glaciological instrumentation capable of automatically recording the daily rate of melting in exceptional melt circumstances, where the ice surface lowers by close to 10 m in a few months, has only emerged in the last decade or so, thanks to PROMICE. The detail of PROMICE observations is permitting new insights on brief, but consequential, exceptional melt events,” says William Colgan of the Lassonde School of Engineering at York University, a co-author of the study.
Fausto adds that, “Exceptional melt episodes dominated by non-radiant energy are expected to occur more frequently in the future due to climate change. This makes it critical to better understand the influence of these episodes on ice sheet health.”
Reference:
Robert S. Fausto, Dirk van As, Jason E. Box, William Colgan, Peter L. Langen, Ruth H. Mottram. The implication of non-radiative energy fluxes dominating Greenland ice sheet exceptional ablation area surface melt in 2012. Geophysical Research Letters, 2016; DOI: 10.1002/2016GL067720
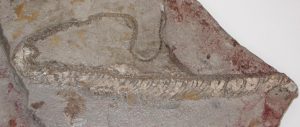
This image depicts the fossilized colubrid snake. The cream-colored material is fossilized skin; the specimen is missing a head. Credit: McNamara et al./Current Biology 2016
Ten million years ago, a green and black snake lay coiled in the Spanish undergrowth. Once, paleontologists would have been limited to the knowledge they could glean from its colorless fossil remains, but now they know what the snake looked like and can guess how it acted. Researchers reporting on March 31 in Current Biology have discovered that some fossils can retain evidence of skin color from multiple pigments and structural colors, aiding research into the evolution and function of color.
So far, scientists filling the ancient-Earth coloring book with pigment have been limited to browns, blacks, and muddy reds when melanin lasts as organic material. No other pigments have been shown to survive fossilization. But this snake’s skin was fossilized in calcium phosphate, a mineral that preserves details on a subcellular level.
The fossilized snakeskin maintained the unique shapes of different types of pigment cells, which would have created yellows, greens, blacks, browns, and iridescence while the animal was alive. The pigments themselves are now decayed, but with the cell shapes–specific to each kind of pigment–mineralized, there’s enough information to reconstruct their colors.
“When you get fossil tissues preserved with this kind of detail, you’re just gobsmacked when you’re looking at it under the microscope,” says first author Maria McNamara, a paleobiologist at University College Cork. “I was astounded. You almost can’t believe what you’re seeing.”
McNamara first came across the fossilized snake while conducting her PhD research on fossils from the Libros site in Spain, but she only recently analyzed the specimen. Her team discovered the mineralized skin cells when viewing the fossil under a high-powered scanning electron microscope and then matched the shapes up with pigment cells in modern snakes to determine what colors they might have produced.
“For the first time, we’re seeing that mineralized tissues can preserve evidence of color,” says McNamara. The researchers determined that the fossilized snakeskin had three types of pigment cells in various combinations: melanophores, which contain the pigment melanin; xanthophores, which contain carotenoid and pterin pigments; and iridophores, which create iridescence. All told, the snake was a mottled green and black, with a pale underside–colors that likely aided in daytime camouflage.
“Up until this discovery, the only prospect for skin color being preserved in fossils was organic remains related to melanin,” says McNamara. “But now that we know color can be preserved even for tissues that are mineralized, it’s very exciting.”
Calcium phosphate mainly shows up in fossil bones and shells, but records do exist of so-called phosphatized skin. This discovery opens the door for re-analysis of these fossils, occurring across a wide range of creatures and locations, for evidence of color preservation. And knowing the color of an animal can also clue researchers in to some aspects of its behavior and evolution.
“It’ll mean re-evaluating a lot of specimens that might have been overlooked,” says McNamara.
Reference:
McNamara et al. Reconstructing carotenoid-based and structural coloration in fossil skin. Current Biology, 2016 DOI: 10.1016/j.cub.2016.02.038
Note: The above post is reprinted from materials provided by Cell Press.
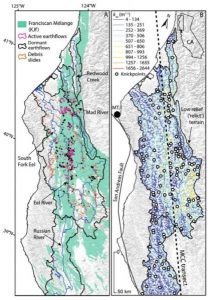
Regional and geological setting and landslides mapped within four study catchments spanning Mendocino crustal conveyer transect (northern California, USA). Credit: Geology and Bennett et al.
Landscapes are formed by a combination of uplift and erosion. Uplift from plate tectonics raises the land surface; erosion by rivers and landslides wears the land surface back down. In this study, Georgina L. Bennett and colleagues examine the interplay of uplift and erosion along the coast range of Northern California to understand how the modern topography is built.
This region is unique in that a wave of uplift is sweeping north through the Coast Range, allowing geoscientists to document the erosional response and assess the timescale of the process. Bennett and colleagues find that rivers cut down through the uplifting land surface, steepening surrounding hillslopes and triggering landslides when hillslope angles reach a limit.
Landslides are the main erosional process balancing uplift in the region. However, intriguingly, they may also have a negative feedback to ongoing erosion, through the delivery of large resistant rocks to rivers that act to armor the riverbed from ongoing erosion. Thus the erosion of parts of the Coast Ranges in response to uplift may be delayed. These findings have implications for understanding landscape evolution, as well as hazards such as landslides.
Reference:
Georgina L. Bennett, Scott R. Miller, Joshua J. Roering, David A. Schmidt. Landslides, threshold slopes, and the survival of relict terrain in the wake of the Mendocino Triple Junction. Geology, 2016; G37530.1 DOI: 10.1130/G37530.1
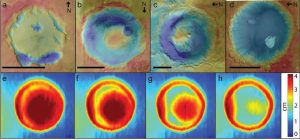
This images shows sediment-filled craters on Mars (top) in different stages of erosion compared with results of a crater model in a wind tunnel experiment (bottom). Warm colors reflect high elevation, and cool colors low elevation. Credit: Mackenzie Day
New research has found that wind carved massive mounds of more than a mile high on Mars over billions of years. Their location helps pin down when water on the Red Planet dried up during a global climate change event.
The research was published in the journal Geophysical Research Letters, a journal of the American Geophysical Union, on March 31.
The findings show the importance of wind in shaping the Martian landscape, a force that, on Earth, is overpowered by other processes, said lead author Mackenzie Day, a graduate student at The University of Texas at Austin Jackson School of Geosciences.
“On Mars there are no plate-tectonics, and there’s no liquid water, so you don’t have anything to overprint that signature and over billions of years you get these mounds, which speaks to how much geomorphic change you can really instigate with just wind,” Day said. “Wind could never do this on Earth because water acts so much faster, and tectonics act so much faster.”
Day conducted the research with Jackson School researchers Gary Kocurek and David Mohrig of the Department of Geological Sciences and University of Texas at Dallas researcher William Anderson.
First spotted during NASA’s Viking program in the 1970s, the mounds are at the bottom of craters. Recent analysis by the Mars rover Curiosity of Mount Sharp, a mound over three miles high inside Gale Crater, has revealed that the thickest ones are made of sedimentary rock, with bottoms made of sediments carried by water that used to flow into the crater and tops made of sediments deposited by wind. However, how the mounds formed inside craters that were once full of sediments was an open question.
“There’s been a theory out there that these mounds formed from billions of years of wind erosion, but no one had ever tested that before,” Day said. “So the cool thing about our paper is we figured out the dynamics of how wind could actually do that.”
To test whether wind could create a mound, the researchers built a miniature crater 30 centimeters wide and 4 centimeters deep, filled it with damp sand, and placed it in a wind tunnel. They tracked the elevation and the distribution of sand in the crater until all of it had blown away. The model’s sediment was eroded into forms similar to those observed in Martian craters, forming a crescent-shaped moat that deepened and widened around the edges of the crater. Eventually all that was left of the sediment was a mound — which, in time, also eroded away.
“We went from a filled crater layer cake to this mounded shape that we see today,” Day said.
To understand the wind dynamics, researchers also built a computer model that simulated how the wind flowed through the crater at different stages of erosion.
The mounds’ structure helps link their formation to climate change on Mars, Kocurek said, with the bottom being built during a wet time, and the top built and mound shaped in a dry time.
“This sequence signals the change from a dominance of depositional processes by water during a wetter time, to wind reworking of these water-laid sediments with the onset of aridity, followed by wind erosion once these sediment supplies have been exhausted,” he said. “Overall, we are seeing the complete remaking of the sedimentary cycle on Mars to the one that characterizes the planet today.”
The research helped scientists home in on Mars’ Noachian period, a geologic era that began about 3.7 billion years ago, as the period when Mars started to change from a wet world to a dry one. Scientists were able to link the climate change to the Noachian by studying the location of more than 30 mounds and finding that sedimentary mounds were only present on terrain that was exposed during that period.
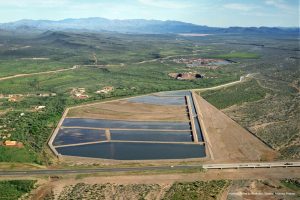
The Agua Fria Water Recharge Facility, a spreading basin in Arizona. Water collected by the facility percolates into the aquifer below it. Credit: Central Arizona Project
Although years of drought and over-pumping have significantly depleted groundwater in Arizona and California, a new study shows the situation has an upside: It has created underground reservoirs where extra surface water can be stored during wet times so it is available during drought.
The study, published in the journal Environmental Research Letters in March, also found that regions that actively store surface water in underground aquifers have increased their groundwater supply over time, even as surrounding areas depleted theirs.
The findings are important because they show that techniques used to increase groundwater storage are working. With projected increases in droughts and floods with climate change, and California investing $2.7 billion to expand water storage, these techniques could help drought-prone regions prepare for extremes, said lead author Bridget Scanlon of The University of Texas at Austin’s Bureau of Economic Geology. The bureau is a research unit at The University of Texas Jackson School of Geosciences.
“In many regions now we’re dealing with these extremes of drought and then intense floods, and that’s a real challenge for water resource managers,” Scanlon said. “To try and resolve this disconnect between supply and demand, we can store water in depleted aquifers.”
The study examined decades’ worth of groundwater data from California’s Central Valley and active management areas across central Arizona—both regions that collect extra water from surface reservoirs and store it in underground aquifers using a technique called managed aquifer recharge. The method has been used in the Central Valley since the 1960s and in Arizona since the 1990s.
As part of the storage strategy, the regions also managed their water resources through conjunctive use, relying primarily on surface aquifers during wet periods and on groundwater during dry periods.
“When you do that, you stop pumping the groundwater so it can recover,” Scanlon said. “But you are also adding recharge from surface water, so you have a double benefit.”
The researchers found that groundwater in Arizona’s active management areas has been rising an average of 0.3 to 1.6 feet per year since the early 2000s. In contrast, nearby areas saw groundwater declines of 1.5 to 4 feet per year. The Central Arizona Project aqueduct, completed in 1993, allowed aquifer recharge and conjunctive use by delivering water from Lake Mead that replaced groundwater-based irrigation in farms. The water was also transported to spreading basins where it percolated into the aquifer.
In California, the researchers found that water imported through the Central Valley Project and California State Water Project canals helped reverse long-term declining groundwater levels by reducing groundwater pumping during wet periods and recharging groundwater using spreading basins. For instance, in one managed aquifer recharge site, the study shows that groundwater levels today would be about 300 feet lower if water storage techniques had not been applied. And although declines in groundwater levels were observed during drought, the declines were not as dramatic as those observed outside of the managed aquifer recharge areas.
Thomas Harter, the Robert M. Hagan Endowed Chair in Water Management and Policy at the University of California, Davis, said the research illustrates the value of groundwater recharge techniques by blending long-term data with detailed accounts of water management strategies.
“I appreciate Bridget’s work to provide a synthesis, not just in California, but also the comparison between California and Arizona, that points toward the larger, global significance of aquifer recharge and conjunctive use,” Harter said.
There is plenty of storage space left in aquifers, researchers found. Central Valley aquifers have about 44 cubic kilometers of space, the same amount of space as all of California’s surface reservoirs. In Arizona, the space in the aquifers corresponds to about 100 cubic kilometers of space, about three times the capacity of Lake Mead, the largest surface reservoir in the U.S.
Developing additional aquifer recharge projects could help fill the empty space and enhance water security during climate extremes, Scanlon said.
“These approaches will help in dealing with these current extremes and will help in the future when we have to deal with them even more,” Scanlon said.
Robert Reedy and Kristine Uhlman from the bureau and Claudia Faunt and Don Pool from the U.S. Geological Survey in California and Arizona also worked on the study.
The study was funded by the State of Texas Advanced Resource Recovery Program and the Jackson School of Geosciences.
There are more than 10,000 species of bird living on Earth today. If you recognise that birds are living dinosaurs, which overwhelming evidence indicates that they are, then this makes them more diverse than their living mammalian counterparts. So if you take the number of species to mean anything, this means we’re still in the reign of the dinosaurs! These days they’re just mostly a bit smaller and fluffier than their Mesozoic ancestors.
But one massive question still remains for Palaeontologists and Neontologists: Why are there so many bird species around today, when we have relatively so few dinosaurs in the fossil record? This disparity is even more extreme when you consider that while non-avian dinosaurs were around for about 170 million years, there were only ever about 800 or so species of dinosaur, based on current records. The actual number fluctuates through time, as new species are discovered, and others are shown to be invalid through research broadly known as ‘taxonomy’.
Recently, Jostein Starfelt and Lee Hsiang Liow of the University of Oslo made a major step forward in answering one of the key questions related to this: Just how many dinosaur species were there in reality?
Most previous studies of dinosaur diversity have only looked at relative diversity, which assess proportional changes from one time to another. But how do you actually estimate the real total number of dinosaurs through time?
How do Palaeontologists read the fossil record?
One of the major problems in calculating diversity is that the fossil record is a poor representation of the biological part of ecosystems. Animals are preserved differently due to differences in their anatomy. Also, not all animals have the same chance of becoming fossils, based on where they happen to find their final resting place.
Furthermore, the geological record is preserved differently through space and time, due to where seas and rivers were to deposit sediment, and due to processes of mountain building and erosion.
Once you get past these two hurdles, humans have then sampled this record differently through time, for example by collecting only from rocks where they know there is a high probability of finding new fossils, also known as the ‘bonanza effect’.
Dinosaurs be TRiPSin’..
All of this variation is broadly known as sampling bias. While many methods have been developed to account for these biases in different ways, Starrfelt and Liow developed a brand new one called TRiPS, which stands for True Richness estimated using a Poisson Sampling Model. This accounts for variation in the sampling of the dinosaur record by estimating both the bias and the overall diversity (richness) based on variation in the number of times each dinosaur species occurs at different points in time. For example, if we know lots of specimens of a particular dinosaur species, we can infer that it has a relatively high preservation potential and collection probability. The authors used this to investigate the dynamics of dinosaur diversity through time, and to assess possible extinction events in their history.
Using this new method, applied to the whole known dinosaur record through the whole of the Mesozoic (Triassic to the end of the Cretaceous), they estimated that 1543-2468 species existed altogether around the globe. While the authors acknowledge that this is a crude estimate, it is largely convergent on previous calculations too.
Importantly, this number is much higher than what is currently known from the fossil record. If you break this down into the three major dinosaur groups, a slightly different pattern emerges. Theropods, the mostly carnivorous group leading to modern birds, had almost twice as many species (1115) than either the long-necked sauropods (513) or bird-hipped ornithischians (508).
Steve Brusatte of the University of Edinburgh is sceptical though: “I would take these numbers with an ocean full of salt”, he said. “There are over 10,000 species of birds – living dinosaurs – around today. So saying there were only a few thousand dinosaur species that lived during 150+ million years of the Mesozoic doesn’t pass the sniff test. That’s not the fault of the authors. They’ve employed advanced statistical methods that take the data as far as it can go. The problem is the data. The fossil record is horrifically biased. Only a tiny fraction of all living things will ever be preserved as fossils. So what we find is a very biased sample of all dinosaurs that ever lived, and no amount of statistical finagling can get around that simple unfortunate truth.”
Jostein Starrfelt also thinks that there is more work to be done in this domain: “Our estimate of total dinosaur richness of approximately 2000 species was done attempting to combine the sampling probabilities from all stages of the Mesozoic and should be interpreted with caution, and my gut feeling is that the total number of dinosaur species for the whole Mesozoic is higher than our total estimate suggests.”
The future of dinosaur hunting
So what does all of this mean for dinosaur hunters? Well, it suggests that there are still hundreds more to be found out there! So get your hiking boots out and go track some dinosaurs!
Brusatte said “There are huge swaths of the planet and huge stretches of the Mesozoic that have yielded few or no dinosaur fossils. The Middle Jurassic and mid Cretaceous are notoriously poorly sampled, as are Antarctica, Australia, and much of Africa. It’s only been over the last few decades that we’ve come to appreciate the bounty of Chinese dinosaurs, and they keep coming at a furious pace. We still have a lot to find.” Indeed, Starrfelt agreed that their method could be used to “get a better picture of which continents are under-sampled and for which periods (and could thus deserve some more human effort).”
It also hints that there might be something fundamentally different about the evolutionary biology of bird-line dinosaurs, and non-avian dinosaurs. Many studies are beginning to unravel the origins and diversification of modern birds, but these will only truly shed light if they are considered in the wider context of dinosaur diversity through time.
Starrfelt also hinted at his future plans with this line of research. “As with most scientific endeavours I wouldn’t say that TRiPS has solved the major problems of using the fossil record as a source of information about the dynamics of clades; but that it might be a good start. The approach lends itself easily to being extended; in the future we might be able to include information about the ‘human effort’ part of fossil bias by interpreting the sampling rate as the product of a fossilization rate and a ‘discovery probability’, for instance. We’re also in the process of putting TRiPS in a Bayesian framework.” How exciting!
Only by being able to estimate diversity with greater accuracy through space and time can we begin to understand the forces that have shaped the evolutionary history of animals.
So many birdies! (Source)
Reference:
Jostein Starrfelt et al. How many dinosaur species were there? Fossil bias and true richness estimated using a Poisson sampling model, Philosophical Transactions of the Royal Society B: Biological Sciences (2016). DOI: 10.1098/rstb.2015.0219
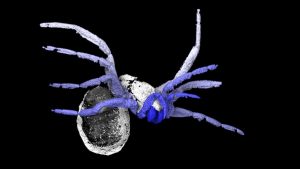
Fossil of Idmonarachne brasieri. Credit: Garwood et al 2016 / Museum National d’Histoire Naturelle, Paris.
A team of researchers has discovered the fossil of a 305-million-year-old arachnid, which will help scientists to understand more about the early origins of modern-day spiders.
The new species, named Idmonarachne brasieri in honour of Professor Martin Brasier, University of Oxford, who passed away in December 2014, was found in Montceau-les-Mines, France, and researchers from The University of Manchester, Berlin’s Museum für Naturkunde, the University of Kansas and Imperial College London have worked with the Natural History Museum and the UK’s Diamond Light Source to scan and examine the fossil in detail.
Details of the origins of spiders remain limited, with little knowledge of their predecessors and no insights into character acquisition early in their evolution. This fossil was preserved in 3D, which enabled the researchers to investigate its minute anatomical details.
We have known since 2008 that a group called the uraraneids were a sister group to true spiders — they could make silk, but probably laid it down in sheets, rather than spinning it as modern spiders do. They also had a tail-like structure at the end called a flagellum. Analysis of Idmonarachne brasieri suggests that as the spider lineage evolved, the animals lost their tail-like structure, and developed spider-like fangs and limbs. Whilst they could likely make silk, the ancestors lacked the ability to spin it using specialised appendages called spinnerets. These are the features that define true spiders, and give them more control over the use and distribution of silk.
Lead author Russell Garwood, of The University of Manchester’s School of Earth, Atmospheric & Environmental Sciences, said, “Our new fossil occupies a key position in the evolution of spiders. It isn’t a true spider, but has given us new information regarding the order in which the bits of the anatomy we associate with spiders appeared as the group evolved.”
This is part of an ongoing effort to look at early arachnids, and see what this can tell us about the early evolution of the group, how they came onto land and what their evolutionary tree looks like. Arachnids as a whole are a very diverse group, but working out how they are all related to each other has proved a challenge. The authors hope that by better understanding these fossils, they can help fill in some of the blanks.
Reference:
Russell J. Garwood, Jason A. Dunlop, Paul A. Selden, Alan R. T. Spencer, Robert C. Atwood, Nghia T. Vo, Michael Drakopoulos. Almost a spider: a 305-million-year-old fossil arachnid and spider origins. Proceedings of the Royal Society B: Biological Sciences, 2016; 283 (1827): 20160125 DOI: 10.1098/rspb.2016.0125
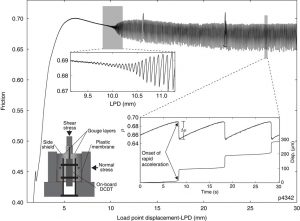
Friction data for one experiment (p4342) at a normal stress of 12 MPa and shearing rate of 10 μm s−1. The upper inset shows spontaneous emergence of unstable slow slip. Stick–slip amplitude increases gradually over a few millimetres before reaching steady state. The lower right inset shows details of fault slip events, note the gradual acceleration at the start of each failure event. The lower left inset shows the double direct shear configuration and locations of displacement transducers. Spikes at 13 and 22 mm displacement are due to brief pauses in shearing to reset displacement transducers.
Up until now catching lightning in a bottle has been easier than reproducing a range of earthquakes in the laboratory, according to a team of seismologists who can now duplicate the range of fault slip modes found during earthquakes, quiet periods and slow earthquakes.
“We were never able to make slow stick slip happen in the laboratory,” said Christopher Marone, professor of geosciences, Penn State. “Our ability to systematically control stick velocity starts with this paper.”
The research, led by John Leeman, Ph.D. candidate in geoscience and including Marone, Demian Saffer, professor of geosciences at Penn State and Marco Scuderi, a former Ph.D. student in geosciences now at Sapienza Università di Roma, Italy, recreated the forces and motion required to generate slow earthquakes in the laboratory using ground quartz and a machine that can apply pressure on the materials altering stresses and other parameters to understand frictional processes.
“While regular earthquakes are catastrophic events with rupture velocities governed by elastic wave speed, the processes that underlie slow fault slip phenomena, including recent discoveries of tremor, slow-slip and low-frequency earthquakes, are less understood,” the researchers report in Nature Communications.
Catastrophic earthquakes, the kind that destroy buildings and send people scurrying for doorways and safe locations, are caused when two tectonic plates that are sliding in opposite directions stick and then slip suddenly, releasing a large amount of energy, creating tremors and sometimes causing destruction. Along regions of faults that do not produce earthquakes, the two sides of the fault slowly slip past each other in a stable fashion. Slow earthquakes occur somewhere between the stable regime and fast stick slip.
Regular earthquakes take place rapidly, while slow earthquakes occur on time scales that may range up to months. They can be as large as magnitude 7 or more and may be precursors to regular earthquakes. However, slow earthquakes propagate slowly and do not produce high-frequency seismic energy. They exist in the regime between stable slipping and regular earthquakes.
The researchers applied stress perpendicular to the direction of shear and then applied forces to shear the ground quartz. By altering the amount of stress placed in the perpendicular direction, they could achieve the audible crack of a regular earthquake, stable slippage and a wide range of slip-stick behaviors including slow earthquake.
“What’s really cool about this is that nobody has been able to systematically produce a slow earthquake, stable sticking, the whole range between a slow and fast earthquake,” said Marone.
Reference:
J. R. Leeman, D. M. Saffer, M. M. Scuderi, C. Marone. Laboratory observations of slow earthquakes and the spectrum of tectonic fault slip modes. Nature Communications, 2016; 7: 11104 DOI: 10.1038/ncomms11104
Note: The above post is reprinted from materials provided by Penn State. The original item was written by A’ndrea Elyse Messer.
The ancient monster shark attacks seals Credit: Catmando / fotolia
It lived millions of years ago and was three times as large as the great white shark: the megalodon. So far its extinction has been explained with the onset of an ice age. However, researchers at the University of Zurich have now come to the conclusion that responsibility for the decline of the monster shark lays not with the climate, but with other species.
Is there anyone out there who doesn’t know Jaws, the film about the great white shark and the devastation it wreaked? But there have been even bigger and more dangerous sharks in the past: The largest shark in the history of the planet, Carcharocles megalodon, lived between 23 million and 2.6 million years ago, reaching body lengths of up to 18 meters and probably feeding on marine mammals. Then it became extinct. In the past, climate changes have generally been blamed for its disappearance. Now, for the first time, researchers from the University of Zurich have examined the geographical distribution of the megalodon over time and arrived at the following conclusion: The giant shark became extinct because the diversity of its prey decreased and new predators appeared as competitors.
200 records from all over the globe
The team surrounding Catalina Pimiento from the Paleontological Institute and Museum of the University of Zurich assessed roughly 200 megalodon records from museum collections and databases, ranging in age for more than 20 million years. Based on these data, the scientists reconstructed the range and the abundance of this prehistoric animal: In the early Miocene, up to approximately 16 million years ago, they were mainly found in the Northern Hemisphere in the warm waters off the coast of America, around Europe and in the Indian Ocean, but they later penetrated further into the Asian, Australian and South American coasts. Abundance of the species peaked in the middle Miocene, while the largest geographical coverage did not take place until the late Miocene. The continuous decline (see charts) followed around 5 million years ago with the gradual emergence of a glacial period during the Pliocene.
Food resources disappear
“We were not able to ascertain any direct link between the extinction of C. megalodon and the global fluctuations in temperatures during this time. Changing climatic conditions do not appear to have had any influence on the population density and range of the giant sharks,” explains Pimiento. Their numbers did not decline in colder periods, nor did they increase significantly in rising water temperatures.
Instead, the evolutionary narrative of other species seems to have had an effect on the development of the monster sharks. When Megalodon range shrank, numerous smaller marine mammal species disappeared. The second factor was the appearance of new predators such as the ancestors of the killer whale and the great white shark. The results suggest that these species could have competed for the increasingly scarce food sources.
Reference:
Catalina Pimiento, Bruce J. MacFadden, Christopher Clements, Sara Varela, Carlos Jaramillo, Jorge Velez-Juarbe and Brian Silliman. Geographical distribution patterns of Carcharocles megalodon over time reveal clues about extinction mechanisms. 30. March 2016, Journal of Biogeography. DOI: 10.1111/jbi.12754
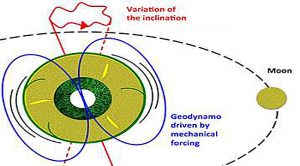
The gravitational effects associated with the presence of the Moon and Sun cause cyclical deformation of the Earth’s mantle and wobbles in its rotation axis. This mechanical forcing applied to the whole planet causes strong currents in the outer core, which is made up of a liquid iron alloy of very low viscosity. Such currents are enough to generate the Earth’s magnetic field. Credit: Julien Monteux and Denis Andrault.
The Earth’s magnetic field permanently protects us from the charged particles and radiation that originate in the sun. This shield is produced by the geodynamo, the rapid motion of huge quantities of liquid iron alloy in the Earth’s outer core. To maintain this magnetic field until the present day, the classical model required the Earth’s core to have cooled by around 3,000° C over the past 4.3 billion years. Now, a team of researchers from CNRS and Université Blaise Pascal1 suggests that, on the contrary, its temperature has fallen by only 300° C. The action of the moon, overlooked until now, is thought to have compensated for this difference and kept the geodynamo active. Their work is published on 30 march 2016 in the journal Earth and Planetary Science Letters.
The classical model of the formation of Earth’s magnetic field raised a major paradox. For the geodynamo to work, the Earth would have had to be totally molten four billion years ago, and its core would have had to slowly cool from around 6800° C at that time to 3800° C today. However, recent modeling of the early evolution of the internal temperature of the planet, together with geochemical studies of the composition of the oldest carbonatites and basalts, do not support such cooling. With such high temperatures being ruled out, the researchers propose another source of energy in their study.
The Earth has a slightly flattened shape and rotates about an inclined axis that wobbles around the poles. Its mantle deforms elastically due to tidal effects caused by the moon. The researchers show that this effect could continuously stimulate the motion of the liquid iron alloy making up the outer core, and in return generate Earth’s magnetic field. The Earth continuously receives 3700 billion watts of power through the transfer of the gravitational and rotational energy of the Earth-moon-sun system, and over 1,000 billion watts is thought to be available to bring about this type of motion in the outer core. This energy is enough to generate the Earth’s magnetic field, which together with the moon, resolves the major paradox in the classical theory. The effect of gravitational forces on a planet’s magnetic field has already been well documented for two of Jupiter’s moons, Io and Europa, and for a number of exoplanets.
Since neither the Earth’s rotation around its axis, nor the direction of its axis, nor the moon’s orbit are perfectly regular, their combined effect on motion in the core is unstable and can cause fluctuations in the geodynamo. This process could account for certain heat pulses in the outer core and at its boundary with the Earth’s mantle.
Over the course of time, this may have led to peaks in deep mantle melting and possibly to major volcanic events at the Earth’s surface. This new model shows that the moon’s effect on the Earth goes well beyond merely causing tides.
Reference:
Denis Andrault et al. The deep Earth may not be cooling down, Earth and Planetary Science Letters (2016). DOI: 10.1016/j.epsl.2016.03.020
Note: The above post is reprinted from materials provided by CNRS.
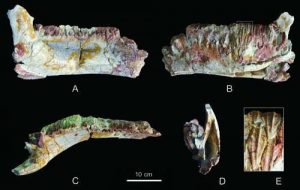
Photos of right dentary of Datonglong tianzhenensis. A, lateral view; B, medial view; C, dorsal view; D, caudal view; E, close-up of partial dentition in B. Credit: XU Shichao
The origin of hadrosaurid dinosaurs is far from clear, mainly due to the paucity of their early Late Cretaceous close relatives. Compared to numerous Early Cretaceous basal hadrosauroids, which are mainly from Eastern Asia, only six early Late Cretaceous basal hadrosauroids have been found: three from Asia and three from North America. In a study published online October 18 in PLoS ONE 8(10), Dr. YOU Hailu, Institute of Vertebrate Paleontology and Paleoanthropology, Chinese Academy of Sciences (IVPP), and his collaborators from Shanxi Museum of Geological and Mineral Science and Technology, Shanxi Province of China described a new hadrosauroid dinosaur, Yunganglong datongensis gen. et sp. nov., from the early Late Cretaceous Zhumapu Formation of Shanxi Province in northern China. This find adds another record of basal Hadrosauroidea in the early Late Cretaceous, and helps to elucidate the origin and evolution of Hadrosauridae.
The new taxon is represented by an associated but disarticulated partial adult skeleton, including the caudodorsal part of the skull, two cervical vertebrae, partial dorsal neural arch and neural processes, two caudals, distal portions of both ischia, distal end of left femur, proximal portion of right tibia, and distal portion of left tibia with astragalus.
Hadrosauroids were facultative bipedal dinosaurs that dominated Cretaceous Laurasian megaherbivorous niches. During the Late Cretaceous, they gave rise to hadrosaurid dinosaurs, which are characterized by duck-like bills and complex grinding dentitions that rival those of horses and bovids.
Cladistic analysis and comparative studies show that Yunganglong represents one of the most basal Late Cretaceous hadrosauroids and is diagnosed by a unique combination of features in its skull and femur.
“Basal hadrosauroids are mainly known from the Early Cretaceous of Eastern Asia, and especially northern China. Therefore, the discovery of new early Late Cretaceous basal hadrosauroids has important phylogenetic and paleobiogeographical significance and can help elucidate the evolution of hadrosauroids, especially the origin of hadrosaurids”, said Dr. YOU Hailu, corresponding author of the study.
This study was supported by the National Natural Science Foundation of China, the Hundred Talents Project of the Chinese Academy of Sciences, and the Department of Land and Resources of Shanxi Province.
Fig.1 Photos of caudodorsal part of the skull of Yunganglong datongensis. A, right lateral view; B, dorsal view; C, caudal view. Scale bar 10 cm. (Image by YOU Hailu)
Fig.2 Distal end of left femur of Yunganglong datongensis. A, cranial view; B, caudal view; C, proximal view; D, distal view; E, Lateral view; F, medial view. Scale bar = 10 cm. (Image by YOU Hailu)
Reference:
A new hadrosauroid dinosaur from the Late Cretaceous of Tianzhen, Shanxi Province, China. DOI:10.1371/journal.pone.0077058
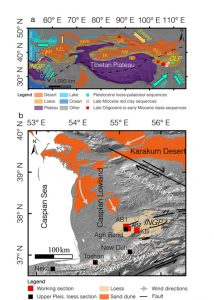
(a) Schematic map showing loess and desert distribution in mid-latitude Asia (b) Schematic map showing the location of studied sections, loess distribution, tectonic regime, and the dominant near-surfacewind directions around the NIGP.
Famous for its deserts, arid central Asia (ACA) is one of the driest regions in the mid-latitudes and one of the main potential dust sources for the northern hemisphere. The mobilization, transportation, and deposition of Asian dust played an important role in global mineral dust cycles and had a prolonged and profound impact on global climate changes via direct effects on Earth’s radiative balance as well as by various indirect effects. Thus, reconstruction of the spatiotemporal history of aeolian dust and palaeoclimate in ACA is important for understanding the forcing mechanisms of palaeoclimatic changes in the Asian interior on various time-scales and for predicting future regional climate changes in semi-arid and arid regions under global warming.
The relationship between loess accumulation and long-term climatic history in ACA remained unclear until the present study was conducted, largely due the lack of in situ early Pleistocene loess/dust records in this remote region.
The lower Pleistocene loess in the northeastern Iranian Golestan Province (western ACA) and loess reported from south Tajikistan (central ACA) indicate that there was widespread loess accumulation in ACA during the early Pleistocene. Accumulation of loess is commonly associated with the occurrence of dust storms at the studied sites and the widespread distribution of loess is evidence that dust storms have become frequent in ACA at least since the early Pleistocene.
The transition from shallow marine sediments to loess deposits at ~2.4 Ma in the NIGP documents a dramatic change in the early Pleistocene from a region with a humid, marine-influenced climate to a semi-arid climate.
Fundamentally, the formation of widespread, thick loess deposits requires a substantial source area arid enough to generate aeolian particles, sufficient wind energy to transport the dust, and suitable geomorphological conditions for preserving the deposited dust. Therefore, the accumulation of loess deposits in the NIGP at ~2.4 Ma suggests that an arid environment had formed in the source regions, such as the Karakum Desert and the Caspian Lowland, during the early Pleistocene. This remarkable early Pleistocene aridification in western ACA is broadly consistent with the onset of aridification in central ACA, the expansion of the Taklimakan Desert in northwestern China, and intensified aridification in northeastern China. This suggests that a semi-arid to arid environment developed within a large region of mid-latitude Asia in the early Pleistocene.
Alternations of loess layers and palaeosols in the NIGP document long-term alaeoclimatic changes in western ACA, which are reflected by colour variations. Sedimentological analysis confirmed that the widespread red-coloured sediments underlying the upper Pleistocene loess in the northeastern Golestan are aeolian in origin. Since they are located downwind on the periphery from the potential dust sources of the Karakum Desert and the Caspian Lowland, and are far from areas affected by major glaciations, these deposits on the NIGP are undoubtedly “desert” loess.
Moreover, this idea received further support from the analysis of grain size and thickness of the last glacial loess and the comparison of geochemical signatures of the lower and upper Pleistocene LPS and modern loess.
It was concluded that the climate during the early Pleistocene in the NIGP was semi-arid, but wetter, warmer, and less windy than during the late Pleistocene and present interglacial. The orbital-scale palaeoclimatic changes in ACA were closely linked to the growth and decay of the northern hemisphere ice sheets. There are two possible causes of this relationship. First, the expansion of the ice sheets in the northern hemisphere resulted in cooling of the North Atlantic Ocean and enhanced continentality in the Asian interior. This would have reduced moisture transport to the continental interior and thus increased its aridity, resulting in the accumulation of loess deposits in ACA. An alternative interpretation is that the expansion of the ice sheets intensified the Mongolian-Siberian high-pressure system, which forced the southward migration of the zonal Westerlies which would have resulted in the enhanced incursion of cold air masses derived from high latitudes of Eurasia and reduced the influx of moisture from the Atlantic Ocean.
Reference:
Xin Wang et al. Early Pleistocene climate in western arid central Asia inferred from loess-palaeosol sequences, Scientific Reports (2016). DOI: 10.1038/srep20560
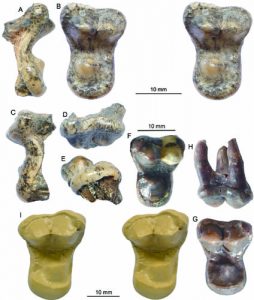
Fig.1 Haplocyonoides cf. H. mordax (A−E) from Aoerban, Nei Mongol, Haplocyonoides mordax (F−H), and Temnocyon percussor (I) from Nebraska. Credit: WANG Xiaoming
Straddling between Europe to the west and North America to the east, Asia has long been suspected to be either a source of certain Cenozoic mammals that, thus far, are only found in Europe and/or North America, or a “jumping board” to and from the continents of destination as they disperse. Temnocyonine and haplocyonine amphicyonids (beardogs) are such an example that have been discovered both in Europend and North America, but remained absent in Asia. A newly discovered amphicyonid from the Early Miocene of central Nei Mongol, reported in the latest issue of Vertebrata PalAsiatica, filled in the long-expected Asian gap, offering new material for studies of Holarctic zoogeography.
The new specimen is an isolated left upper molar collected from the Lower Red Mudstone Member of Aoerban Formation in Sonid Zuoqi, Xilinhot League, central Nei Mongol on August 8, 2015. With the exception of the missing roots, it is almost perfectly preserved, missing only the anterior rim of the enamels at the waist. As shows signs of only minor wear at the apex of the metacone, it represents that of a young adult.
The new molar is strikingly similar to Haplocyonoides mordax and Temnocyon percussor with its dumbbell-shaped M1 outline, reduced parastyle, isolated protocone by a surrounding cingulum, and extreme reduction of pre- and postprotocristae. This molar is highly diagnostic of European haplocyonine or North American temnocyonine, two subfamilies of beardogs that have long been known in those continents but notably absent in Asia.
Temnocyoninae and Haplocyoninae are peculiar lineages of amphicyonids, with hypercarnivorous dentitions and in some species, digitigrade posture. Members of these groups typically have a very trenchant lower molar battery that align their main cusps in a single row to facilitate shearing function and associated narrow, high-crowned premolar series.
“Given the limited material at hand, we tentatively refer the new Chinese fossil to the European Haplocyonoides cf. H. mordax because of their similar size and age relationship”, said lead author Dr. WANG Xiaoming, a visiting professor of Institute of Vertebrate Paleontology and Paleoanthropology (IVPP), Chinese Academy of Sciences, and a senior curator of Natural History Museum of Los Angeles County, “if this identification is correct, our new record thus fills a large gap in the geographic distribution of the haplocyonines and represents an excursion of this rare subfamily from Europe, and confirms, once again, Asia has much to offer in our understanding of Holarctic zoogeography”.
Reference:
New record of a haplocyonine amphicyonid in early Miocene of Nei Mongol fills a long-suspected geographic hiatus. Vertebrata PalAsiatica
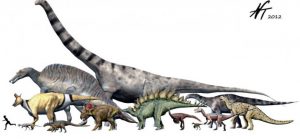
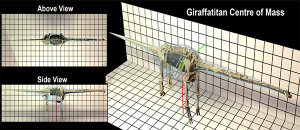
A Giraffatitan model of a Sauropod. Credit: Dr Peter L Falkingham /Liverpool John Moores University
Scientists from the University of Liverpool have developed computer models of the bodies of sauropod dinosaurs to examine the evolution of their body shape.
Sauropod dinosaurs include the largest land animals to have ever lived. Some of the more well-known sauropods include Diplodocus, Apatosaurus and Brontosaurus. They are renowned for their extremely long necks, long tails as well as four thick, pillar-like legs and small heads in relation to their body.
To date, however, there have been only limited attempts to examine how this unique body-plan evolved and how it might be related to their gigantic body size. Dr Karl Bates from the University’s Department of Musculoskeletal Biology and his colleagues used three-dimensional computer models reconstructing the bodies of sauropod dinosaurs to analyse how their size, shape and weight-distribution evolved over time.
Evolutionary history
Dr Bates found evidence that changes in body shape coincided with major events in sauropod evolutionary history such as the rise of the titanosaurs. The early dinosaurs that sauropods evolved from were small and walked on two legs, with long tails, small chests and small forelimbs. The team estimate that this body shape concentrated their weight close to the hip joint, which would have helped them balance while walking bipedally on their hind legs.
As sauropods evolved they gradually altered both their size and shape from this ancestral template, becoming not only significantly larger and heavier, but also gaining a proportionally larger chest, forelimbs and in particular a dramatically larger neck.
The team’s findings show that these changes altered sauropods’ weight distribution as they grew in size, gradually shifting from being tail-heavy, two-legged animals to being front-heavy, four-legged animals, such as the large, fully quadrupedal Jurassic sauropods Diplodocus and Apatosaurus.
The team found that these linked trends in size, body shape and weight distribution did not end with the evolution of fully quadrupedal sauropods. In the Cretaceous period – the last of the three ages of the dinosaurs – many earlier sauropod groups dwindled. In their place, a new and extremely large type of sauropod known as titanosaurs evolved, including the truly massive Argentinosaurus and Dreadnoughtus, among the largest known animals ever to have lived.
Front heavy
The team’s computer models suggest that in addition to their size, the titanosaurs evolved the most extreme ‘front heavy’ body shape of all sauropods, as a result of their extremely long necks.
Dr Bates said: “As a result of devising these models we were able to ascertain that the relative size of sauropods’ necks increased gradually over time, leading to animals that were increasingly more front-heavy relative to their ancestors.”
Dr Philip Mannion from Imperial College London, a collaborator in the research, added: “These innovations in body shape might have been key to the success of titanosaurs, which were the only sauropod dinosaurs to survive until the end-Cretaceous mass extinction, 66 million years ago.”
Dr Vivian Allen from the Royal Veterinary College London, who also collaborated in the research, added: “What’s important to remember about studies like this is that there is a very high degree of uncertainty about exactly how these animals were put together. While we have good skeletons for many of them, it’s difficult to be sure how much meat there was around each of the bones. We have built this uncertainly into our models, ranging each body part from emaciated to borderline obesity, and even using these extremes we still find these solid, trending changes in body proportions over sauropod evolution.”
Reference:
Temporal and phylogenetic evolution of the sauropod dinosaur body plan, Royal Society Open Science, DOI: 10.1098/rsos.150636
Shaped like an upturned boat, drumlin hills (pictured above) are found clustered together in their hundreds and thousands in distinct fields called swarms. They’re the most common landform across large areas of northern North America and Europe, marking the footprint of massive ice sheets that formed during past ice ages. Credit: University of Toronto Scarborough
It’s a mystery that has stumped geologists for more than a century.
Now, thanks to new technology — including satellite laser imagery — researchers may be one step closer to understanding the origins of an archetypal landform: the drumlin hill.
“Drumlin hills are the most studied and yet the most enigmatic ice age landform,” says U of T Scarborough geology professor Nick Eyles. “Thanks to high resolution satellite imagery and new technology like LiDAR, we’re literally seeing the surface of the planet for the first time and finding major surprises in the process.”
Shaped like an upturned boat, drumlin hills are found clustered together in their hundreds and thousands in distinct fields called swarms. They are the most common landform across large areas of northern North America and Europe, marking the footprint of great sheets that formed during past ice ages.
The question that’s stumped geologists since drumlins were first studied more than 150 years ago is whether they were built up progressively or sculpted out of older sediment. Eyles and his team including PhD candidate Shane Sookhan and undergraduate student Lina Arbelaez-Moreno were able to determine that drumlins are simply streamlined “islands” of sediment that are often bisected to form kilometre-long skinny megaridges. Their research, published in the journal Sedimentary Geology, suggests that drumlins and megaridges are all part of a single family of landforms formed by erosion.
“The new data we were able to obtain shows that these landforms occur on hard rock, which stresses the importance of sculpting below the base of the ice sheet,” says Arbelaez-Moreno.
To illustrate the importance of megaridges Eyles points to research being done on the modern Greenland and Antarctica ice sheets. These are slow moving ice sheets but contain faster flowing corridors called ‘ice streams’ that are up to tens of kilometres wide, hundreds of kilometres in length and can move as fast as 1 km annually.
“They’re essentially arteries moving huge volumes of ice toward the margin of the ice sheet,” explains Eyles. The thinning and retreating of modern ice streams in a warming world has exposed their underlying beds which are seen to be megaridged, and that appears to allow the ice to flow faster across its bed by creating a slippery low-friction surface, he adds.
The last Canadian ice sheet (Laurentide) was as much as 3 km thick and behaved in exactly the same way, says Eyles. “The transition from drumlins to megaridges may record the final gasp of the ice sheet as it warmed up and began to stream over its bed.”
Debris that is being dragged under these streams is highly erosive — “think of sandpaper” says Sookhan — and the process sculpts the underlying surface, allowing drumlins to be progressively whittled down into longer and longer megaridges.
The data used by the researchers relied on high resolution satellite imagery and new technologies including LiDAR, which uses hundreds of laser beams fired from planes onto the land below. The result is the creation of highly accurate topographic maps even where landscapes are covered by trees or water.
“We still have a lot to learn about how drumlins are formed, but this imaging technique has changed the science by providing a new way of looking at glacial landscapes,” says Sookhan.
The megaridges identified by Eyles and his team are particularly common around Peterborough, Ontario at the site of one of the most easily accessible drumlin fields in Canada.
“You could say drumlins are quintessentially Canadian,” says Eyles. “They do occur in Europe, but are far more common here because almost the entire country was covered by the Laurentide Ice Sheet during the last ice age.”
Reference:
Nick Eyles, Niko Putkinen, Shane Sookhan, Lina Arbelaez-Moreno. Erosional origin of drumlins and megaridges. Sedimentary Geology, 2016; DOI: 10.1016/j.sedgeo.2016.01.006
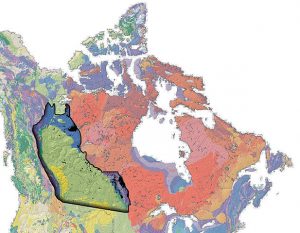
Western Canadian Sedimentary Basin (outlined in black) on a geological map of Canada. / Wikimedia Commons
A survey of a major oil and natural gas-producing region in Western Canada suggests a link between hydraulic fracturing or “fracking” and induced earthquakes in the region, according to a new report published online in the journal Seismological Research Letters.
The study’s findings differ from those reported from oil and gas fields in the central United States, where fracking is not considered to be the main cause of a sharp rise in induced seismicity in the region. Instead, the proliferation of hundreds of small earthquakes in that part of the U.S. is thought to be caused primarily by massive amounts of wastewater injected back into the ground after oil and gas recovery.
The SRL study does not examine why induced seismicity would be linked to different processes in the central U.S. and western Canada. However, some oil and gas fields in the U.S., especially Oklahoma, use “very large amounts of water” in their operations, leading to much more wastewater disposal than in Canadian operations, said Gail M. Atkinson of Western University.
It is possible that massive wastewater disposal in the U.S. is “masking another signal” of induced seismicity caused by fracking, Atkinson said. “So we’re not entirely sure that there isn’t more seismicity in the central U.S. from hydraulic fracturing than is widely recognized.”
The fracking process uses high-pressure injections of fluid to break apart rock and release trapped oil and natural gas. Both fracking and wastewater injections can increase the fluid pressure in the natural pores and fractures in rock, or change the state of stress on existing faults, to produce earthquakes.
The Western Canada Sedimentary Basin (WCSB) contains one of the world’s largest oil and gas reserves, and is dotted with thousands of fracking wells drilled in multi-stage horizontal operations. Atkinson and her colleagues compared the relationship of 12,289 fracking wells and 1236 wastewater disposal wells to magnitude 3 or larger earthquakes in an area of 454,000 square kilometers near the border between Alberta and British Columbia, between 1985 and 2015.
The researchers performed statistical analyses to determine which earthquakes were most likely to be related to hydraulic fracturing, given their location and timing. The analyses identified earthquakes as being related to fracking if they took place close to a well and within a time window spanning the start of fracking to three months after its completion, and if other causes, such as wastewater disposal, were not involved.
Atkinson and colleagues found 39 hydraulic fracturing wells (0.3% of the total of fracking wells studied), and 17 wastewater disposal wells (1% of the disposal wells studied) that could be linked to earthquakes of magnitude 3 or larger.
While these percentages sound small, Atkinson pointed out that thousands of hydraulic fracturing wells are being drilled every year in the WCSB, increasing the likelihood of earthquake activity. “We haven’t had a large earthquake near vulnerable infrastructure yet,” she said, “but I think it’s really just a matter of time before we start seeing damage coming out of this.”
The study also confirmed that in the last few years nearly all the region’s overall seismicity of magnitude 3 or larger has been induced by human activity. More than 60% of these quakes are linked to hydraulic fracture, about 30-35% come from disposal wells, and only 5 to 10% of the earthquakes have a natural tectonic origin, Atkinson said.
Atkinson said the new numbers could be used to recalculate the seismic hazard for the region, which could impact everything from building codes to safety assessments of critical infrastructure such as dams and bridges. “Everything has been designed and assessed in terms of earthquake hazard in the past, considering the natural hazard,” she said. “And now we’ve fundamentally changed that, and so our seismic hazard picture has changed.”
The researchers were also surprised to find that their data showed no relationship between the volume of fluid injected at a hydraulic fracturing well site and the maximum magnitude of its induced earthquake.
“It had previously been believed that hydraulic fracturing couldn’t trigger larger earthquakes because the fluid volumes were so small compared to that of a disposal well,” Atkinson explained. “But if there isn’t any relationship between the maximum magnitude and the fluid disposal, then potentially one could trigger larger events if the fluid pressures find their way to a suitably stressed fault.”
Atkinson and her colleagues hope to refine their analyses to include other variables, such as information about extraction processes and the geology at individual well sites, “to help us understand why some areas seem much more prone to induced seismicity than others.”
The scientists say the seismic risks associated with hydraulic fracturing could increase as oil and gas companies expand fracking’s use in developing countries, which often contain dense populations and earthquake-vulnerable infrastructure.
Reference:
“Hydraulic Fracturing and seismicity in the Western Canada Sedimentary Basin,” Seismological Research Letters, DOI: 10.1785/0220150263
Rangitoto as seen from North Head. Credit: ChewyPineapple/Wikipedia
Rangitoto Island is far older and was active much longer than previously thought, a new study has found.
Associate Professor Phil Shane from the University of Auckland’s School of Environment led a team of researchers in a project over summer 2015 to drill up to 150m below the volcano’s surface to investigate its volcanic past.
Sample cores extracted from the drilling were then analysed using radiocarbon dating technology which showed the volcano is around 6000 years old.
“It was generally thought Rangitoto formed in one or two episodes about 500 to 550 years ago and was geologically a very young volcano but the core samples show it began erupting far earlier, around 6000 years ago,” Dr Shane says.
Rangitoto is unusually large compared to other Auckland volcanoes, representing a third to a half of all magma erupted over the entire history of the Auckland region. Dr Shane suspects the volcano may actually be a cluster of a number of small volcanoes beneath one single, large volcanic edifice.
“That suggests the volcano was intermittently active over a much longer period and grew over time rather than forming in one short burst,” he says.
Geologists now wonder if the eruption behaviour of the Auckland volcanic field has changed. Older volcanoes appear to have erupted in short bursts of just months or years, and there is no pattern to where they formed.
The traditional view was that a new volcano would probably form in a location that had not previously experienced an eruption. In contrast, activity at Rangitoto continued for thousands of years, leading scientists to consider whether future activity will also occur in the general area of Rangitoto.
“The latest findings may have implications for hazard and risk planning,” Dr Shane says.
“It’s important to consider that future eruptions could occur at the volcano or if a new volcano forms, it could be active for a very long time such as hundreds or thousands of years.
“That could mean people having to adapt to living with continuing volcanic activity as they do in Hawaii or Iceland.”
The new results are published in the Geological Society of America Bulletin.
Pair of E. sibiricum. Credit: Stanton F. Fink/Wikipedia/CC BY 2.5
A long-extinct animal known as the Siberian unicorn—which was actually a long-horned rhinoceros—may have walked the Earth 29,000 years ago, at the same time as prehistoric humans, researchers say.
Until now, the Elasmotherium sibiricum was thought to have vanished 350,000 years ago.
But research published in the American Journal of Applied Science describes a far more recent discovery of a well-preserved skull in Kazakhstan.
“Most likely, it was a very large male,” said paleontologist Andrey Shpanski of Tomsk State University (TSU).
“The dimensions of this rhino today are the biggest of those described in the literature.”
Researchers used radiocarbon dating to determine the creature’s age, leading to theories of migration and refuge-seeking in southern corners of Western Siberia for these lumbering legends.
The skull was in relatively good shape, and showed no signs of having been gnawed upon.
Siberian rhinos, which were likely vegetarians, have been described as weighing up to four tons and standing two meters tall by nearly five meters long.
Their habitat extended from the Don River to the east of modern Kazakhstan, said the study.
Shpanski said the findings suggest that other “mass radiocarbon studies” should be done to assess remains of mammals previously believed to have disappeared 50,000-100,000 years ago.
Note: The above post is reprinted from materials provided by AFP.
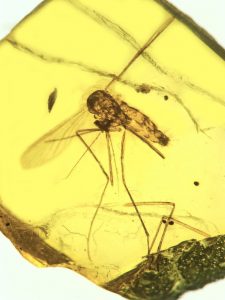
Oldest fossil with Plasmodium malaria Credit: Image courtesy of Oregon State University
A new analysis of the prehistoric origin of malaria suggests that it evolved in insects at least 100 million years ago, and the first vertebrate hosts of this disease were probably reptiles, which at that time would have included the dinosaurs.
Malaria, a scourge on human society that still kills more than 400,000 people a year, is often thought to be of more modern origin — ranging from 15,000 to 8 million years old, caused primarily by one genus of protozoa, Plasmodium, and spread by anopheline mosquitoes.
But the ancestral forms of this disease used different insect vectors and different malarial strains, and may literally have helped shape animal survival and evolution on Earth, according to George Poinar, Jr., a researcher in the College of Science at Oregon State University.
Poinar suggested in the journal American Entomologist that the origins of this deadly disease, which today can infect animals ranging from humans and other mammals to birds and reptiles, may have begun in an insect such as the biting midge more than 100 million years ago. And in previous work, Poinar and his wife, Roberta, implicated malaria and the evolution of blood-sucking insects as disease vectors that could have played a significant role in the extinction of the dinosaurs.
“Scientists have argued and disagreed for a long time about how malaria evolved and how old it is,” Poinar said. “I think the fossil evidence shows that modern malaria vectored by mosquitoes is at least 20 million years old, and earlier forms of the disease, carried by biting midges, are at least 100 million years old and probably much older.”
Since the sexual reproduction stage of malaria only occurs in insects, Poinar said in the new study that they must be considered the primary hosts of the disease, not the vertebrate animals that they infect with disease-causing protozoa. And he believes the evidence points toward the Gregarinida as a protozoan parasite group that could have been the progenitors of malaria, since they readily infect the insects that vector malaria today.
Understanding the ancient history of malaria evolution, Poinar said, might offer clues to how its modern-day life cycle works, how it evolved, and what might make possible targets to interrupt its transmission through its most common vector, the Anopheles mosquito.
Understanding the evolution of malaria also takes one on a worldwide journey, according to evidence found in insects preserved in amber. Poinar is an international expert in using plant and animal life forms preserved in this semi-precious stone to help learn more about the biology and ecology of the distant past.
Poinar was the first to discover a type of malaria in a 15-20 million-year-old fossil from the New World, in what is now the Dominican Republic. It was the first fossil record of Plasmodium malaria, one type of which is now the strain that infects and kills humans.
Even further back, malaria may have been one of the diseases that arose, along with the evolution of insects, and had a huge impact on animal evolution. In a 2007 book, “What Bugged the Dinosaurs? Insects, Disease and Death in the Cretaceous,” George and Roberta Poinar argued that insects carried diseases that contributed to the widespread extinction of the dinosaurs around the “K-T boundary” about 65 million years ago.
“There were catastrophic events known to have happened around that time, such as asteroid impacts and lava flows,” Poinar said. “But it’s still clear that dinosaurs declined and slowly became extinct over thousands of years, which suggests other issues must also have been at work. Insects, microbial pathogens and vertebrate diseases were just emerging around that same time, including malaria.”
Avian malaria has been implicated in the extinction of many bird species in Hawaii just in recent decades, especially in species with no natural resistance to the disease. Different forms of malaria, which is now known to be an ancient disease, may have been at work many millions of years ago and probably had other implications affecting the outcome of vertebrate survival, Poinar said.
The first human recording of malaria was in China in 2,700 B.C., and some researchers say it may have helped lead to the fall of the Roman Empire. In 2015 there were 214 million cases worldwide, according to the World Health Organization. Immunity does not occur naturally and the search for a vaccine has not yet been achieved.
Reference:
George Poinar. What Fossils Reveal About the Protozoa Progenitors, Geographic Provinces, and Early Hosts of Malarial Organisms. American Entomologist, 2016; 62 (1): 22 DOI: 10.1093/ae/tmw006
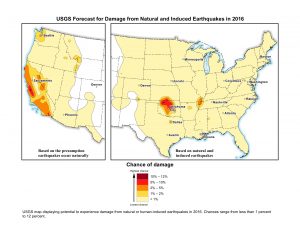
USGS map displaying potential to experience damage from a natural or human-induced earthquake in 2016. Chances range from less than one percent to 12 percent. Credit: USGS
For the first time, new USGS maps identify potential ground-shaking hazards from both human-induced and natural earthquakes. In the past, USGS maps only identified natural earthquake hazards.
This is also the first one-year outlook for the nation’s earthquake hazards, and is a supplement to existing USGS assessments that provide a 50-year forecast
The report shows that approximately 7 million people live and work in areas of the central and eastern U.S. (CEUS) with potential for damaging shaking from induced seismicity. Within a few portions of the CEUS, the chance of damage from all types of earthquakes is similar to that of natural earthquakes in high-hazard areas of California.
“By including human-induced events, our assessment of earthquake hazards has significantly increased in parts of the U.S.,” said Mark Petersen, Chief of the USGS National Seismic Hazard Mapping Project. “This research also shows that much more of the nation faces a significant chance of having damaging earthquakes over the next year, whether natural or human-induced.”
Induced earthquakes are triggered by human activities, with wastewater disposal being the primary cause for recent events in many areas of the CEUS. Wastewater from oil and gas production operations can be disposed of by injecting it into deep underground wells, below aquifers that provide drinking water.
Important Note: USGS scientists only distinguished between human-induced and natural seismicity in the CEUS. In the west, scientists categorized all earthquakes as natural. Scientists also used a different methodology in looking at the CEUS compared to the west.
Six States Face the Highest Hazards
The most significant hazards from induced seismicity are in six states, listed in order from highest to lowest potential hazard: Oklahoma, Kansas, Texas, Colorado, New Mexico and Arkansas. Oklahoma and Texas have the largest populations exposed to induced earthquakes.
“In the past five years, the USGS has documented high shaking and damage in areas of these six states, mostly from induced earthquakes,” said Petersen. “Furthermore, the USGS Did You Feel It? website has archived tens of thousands of reports from the public who experienced shaking in those states, including about 1,500 reports of strong shaking or damage.”
In developing this new product, USGS scientists identified 21 areas with increased rates of induced seismicity. Induced earthquakes have occurred within small areas of Alabama and Ohio but a recent decrease in induced earthquake activity has resulted in a lower hazard forecast in these states for the next year. In other areas of Alabama and small parts of Mississippi, there has been an increase in activity, and scientists are still investigating whether those events were induced or natural.
People living in areas of higher earthquake hazard should learn how to be prepared for earthquakes, and guidance can be found through FEMA’s Ready Campaign.
One-Year Outlook: The Nation’s Shortest Forecast Yet
The new hazard model estimates where, how often and how strongly earthquake ground shaking could occur in the United States during calendar year 2016. The USGS chose this short timeframe of one year because induced earthquake activity can increase or decrease with time and is subject to commercial and policy decisions that could change rapidly.
The USGS National Seismic Hazard Map uses a 50-year forecast because that is the average lifetime of a building, and such information is essential to engineering design and the development of building codes. Building code committees are still determining whether it is appropriate to treat induced earthquakes in building code revisions, in part because induced seismicity changes on short time scales compared to the years it takes for building codes to be updated, reviewed and adopted.
How Will This Help Protect Communities?
The new report can be used by both government officials to make more informed decisions and by emergency response personnel to assess vulnerability and provide safety information to those who are in potential danger. Engineers can use this product to evaluate earthquake safety of buildings, bridges, pipelines and other important structures.
Dramatic Change in the Central U.S.
The central U.S. has undergone the most dramatic increase in seismicity over the past six years. From 1973 to 2008, there was an average of 24 earthquakes of magnitude 3.0 and larger per year. From 2009 to 2015, the rate steadily increased, averaging 318 per year and peaking in 2015 with 1,010 earthquakes. Through mid-March in 2016, there have been 226 earthquakes of magnitude 3.0 and larger in the central U.S. region. To date, the largest earthquake located near several active injection wells was a magnitude 5.6 in 2011 near Prague, Oklahoma.
Research in the Western U.S.
The CEUS has experienced the most significant U.S. increase in seismic activity due to induced earthquakes in recent years. Therefore, in the 2016 forecast, scientists distinguish between human-induced and natural seismicity only for the CEUS. Scientists also used a historical catalog of seismic events leading back to the 1700s, putting a strong emphasis on earthquakes in 2015.
While there are some areas of induced earthquakes in the western U.S., they don’t significantly change the regional hazard level compared to the much more abundant natural earthquakes. Therefore scientists just considered the historical catalog in the western U.S. and did not separate natural from induced earthquakes. Future research could take a more detailed look at induced seismicity in the west, including in California at The Geysers, Brawley or the Los Angeles Basin.
Explanation of Updates — Mostly, But Not All, Are Induced
The USGS published a study in 2014 that only considered natural earthquakes. The largest changes in this new report are primarily due to hazards from induced earthquakes, but the calculations also consider updated forecasts for natural earthquakes since the previous hazard map was released. For example, the New Madrid Seismic Zone near Memphis has experienced a higher rate of natural earthquakes in the past two years, leading to a slightly higher hazard potential in small portions of Arkansas, Missouri, Illinois, Kentucky and Tennessee.
Wastewater disposal is thought to be the primary reason for the recent increase in earthquakes in the CEUS. While most injection wells are not associated with earthquakes, some other wells have been implicated in published scientific studies, and many states are now regulating wastewater injection in order to limit earthquake hazards.
Many questions have been raised about hydraulic fracturing—commonly referred to as “fracking”—and USGS studies suggest that this process is only rarely the cause of felt earthquakes.
Learn more by reading six facts and common questions about human-caused earthquakes.
Distinguishing Between Induced and Natural Earthquakes
To determine whether particular clusters of earthquakes were natural or induced, the USGS relied on published literature and discussions with state officials and the scientific and earthquake engineering community. Scientists looked at factors such as whether an earthquake occurred near a wastewater disposal well and whether the well was active at the time these earthquakes occurred. If so, it was classified as an induced event.
Current research indicates that the maximum magnitudes of induced earthquakes may be lower than for natural earthquakes, but many scientists suggest that induced earthquakes can trigger larger earthquakes on known or unknown faults. In the CEUS, there may be thousands of faults that could rupture in a large earthquake. Induced earthquakes also tend to exhibit swarm-like behavior with more numerous and smaller earthquakes at shallower depths. These factors were taken into account in the analysis.
Testing and Future Research
“We are using the best available data and principles to determine when, where and how strong the ground could shake from induced earthquakes,” said Petersen. “Of course there is a level of uncertainty associated with this and all hazard maps, as we are still learning about their behavior and can only forecast with probability—instead of predict with certainty—where earthquakes are likely to occur in the future. Testing these maps after a year will be important in validating and improving the models.”