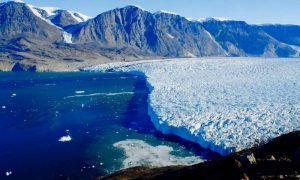
Dartmouth College scientists have found that surface meltwater draining through and underneath Greenland’s tidewater glaciers is accelerating their loss of ice mass. Credit: Dartmouth College
Surface meltwater draining through and underneath Greenland’s tidewater glaciers is accelerating their loss of ice mass, according to a Dartmouth study that sheds light on the relationship between meltwater and subglacial discharge
The findings appear in the journal Annals of Glaciology.
Greenland has the potential to contribute six to seven meters of global sea level rise predominantly through ice mass lost out of large tidewater glaciers. The study’s findings will be used in modeling how water influences glacier melt, glacier flow and glacier stability and to predict global sea level rise for Intergovernmental Panel on Climate Change reports.
“Our results show meltwater from these glaciers is playing a larger role in glacier stability than previously thought,” says lead author Kristin Schild, a doctoral student in Dartmouth’s Department of Earth Sciences. “A clearer understanding of subglacial hydrology at tidewater outlet glaciers is important for understanding the mechanisms controlling fluctuations in ice flow and submarine melt as well as gauging the impact of rapid freshwater delivery to the fjord system.”
Media reports about glacial melting are common, but less attention has been paid to how glaciers are losing mass. Surface meltwater can exploit weaknesses in glaciers, fracturing and weakening the ice as it drains to the bottom. Water under glaciers decreases the friction between the ice and rock, causing the glaciers to move faster. When fresh meltwater exits the glacier into the ocean, it brings warm saltwater to the glacier terminus, which causes melting of the glacier from below (submarine melting). Once this freshwater hits the surface of the ocean, it helps disintegrate the mélange (recently calved icebergs and sea ice) that stabilizes the glacier terminus. Tidewater outlet glaciers discharge most of the Greenland Ice Sheet’s mass through iceberg calving, submarine melting and meltwater runoff. While calving can be observed in person and with remote sensing observations, it is difficult to assess melting within and below glaciers and how the meltwater is discharged.
The Dartmouth team studied a fast-flowing West Greenland tidewater glacier, using time-lapse photography, modeled runoff estimates and ground and satellite imagery to determine how much of the glacier is experiencing melt and when meltwater exits the glacier and enters the fjord. The timing between melt onset and when the meltwater emerges shows how the meltwater travels through and below the glacier.
Their results show that multiple intense plumes of sediment-rich meltwater can occur across a glacier’s terminus, which hasn’t been documented previously, and can increase calving and melting; sediment plumes can break apart the mélange, which weakens the stability of the glacier terminus; and meltwater is being stored under the glacier, which can speed up the glacier’s velocity.
Reference:
Subglacial hydrology at Rink Isbræ, West Greenland inferred from sediment plume appearance, DOI: 10.1017/aog.2016.1
Note: The above post is reprinted from materials provided by Dartmouth College.
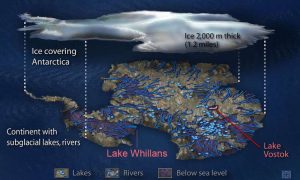
An artist’s conception of the Antarctic subglacial environment. Credit: Zina Deretsky, NSF
Three recent publications by early career researchers at three different institutions across the country provide the first look into the biogeochemistry, geophysics and geology of Subglacial Lake Whillans, which lies 800 meters (2,600 feet) beneath the West Antarctic Ice Sheet.
The findings stem from the Whillans Ice Stream Subglacial Access Research Drilling (WISSARD) project funded by the National Science Foundation (NSF).
Collectively, the researchers describe a wetland-like area beneath the ice. Subglacial Lake Whillans is primarily fed by ice melt, but also contains small amounts of seawater from ancient marine sediments on the lake bed. The lake waters periodically drain through channels to the ocean, but with insufficient energy to carry much sediment.
The new insights will not only allow scientists to better understand the biogeochemistry and mechanics of the lake itself, but will also allow them to use that information to improve models of how Antarctic subglacial lake systems interact with the ice above and sediment below. These models will help assess the contribution that subglacial lakes may have to the flow of water from the continent to the ocean, and therefore to sea-level rise.
In recent decades, researchers, primarily using airborne radar and satellite laser observations, have discovered that a continental system of rivers and lakes—some similar in size to North America’s Great Lakes—exists beneath the miles-thick Antarctic ice sheet. These findings represent some of the very first methodical descriptions of one of those lakes based on actual sampling of water and sediments.
In January 2013, the WISSARD project successfully drilled through the ice sheet to reach Subglacial Lake Whillans, retrieving water and sediment samples from a body of water that had been isolated from direct contact with the atmosphere for many thousands of years. The team used a customized, clean hot-water drill to collect their samples without contaminating the pristine environment.
WISSARD was preceded by ongoing field research that began as early as 2007 to place this individual lake in context with the larger subglacial water system. Those investigations and the sampling of Subglacial Lake Whillans were funded, and the complex logistics provided, by the NSF-managed U.S. Antarctic Program.
Some of the initial analyses of the samples taken from the lake are highlighted in the recent papers, published in three different journals by three scientists whose graduate work was funded, at least in part, through the WISSARD project. They used an array of biogeochemical, geophysical and geological methods to provide unique insights into the dynamics of the subglacial system.
In a paper published in Geophysical Research Letters, lead author Matthew Siegfried, of the Scripps Institution of Oceanography at the University of California, San Diego, and his colleagues report that Global Positioning System (GPS) data gathered over a period of five years indicate that periodic drainage of the lake can increase velocity at the base of the ice sheet and speed up movement of the ice by as much as four percent in episodic bursts, each of which can last for several months.
The authors suggest that these short-term dynamics need to be better understood to help refine prediction of future, long-term ice sheet changes.
In a second paper, published in Geology, lead author Alexander Michaud, of Montana State University, and his colleagues—including two other Montana State WISSARD-trained students, graduate student Trista Vick-Majors and undergraduate student, Will van Gelder—used data taken from a 38-centimeter (15-inch) long core of lake sediment to characterize the water chemistry in the lake and its sediments.
Their findings indicate that lake water comes primarily from melting at the base of the ice sheet covering the lake, with a minor contribution from seawater, which was trapped in sediments beneath the ice sheet during the last interglacial period, when the Antarctic ice sheet had retreated. This ancient, isolated reservoir of ocean water continues to affect the biogeochemistry of this lake system. This new finding contrasts with previous studies from neighboring ice streams, where water extracted from subglacial sediments did not appear to have a discernable marine signature.
In the third paper, published in the journal Earth and Planetary Science Letters, lead author Timothy Hodson of Northern Illinois University and his colleagues examined another sediment core taken from the lake to discover more about the relationship between the ice sheet, subglacial hydrology and underlying sediments.
Their findings show that even though floods pass through the lake from time to time, the flow is not powerful enough to erode extensive drainage channels, like the rivers that drain much of the Earth’s surface. Rather the environment beneath this portion of the ice sheet is somewhat similar to a wetland within a coastal plain, where bodies of water tend to be broad and shallow and where water flows gradually.
Together, these new publications highlight an environment where geology, hydrology, biology and glaciology all interact to create a dynamic subglacial system, which can have global impacts.
Helen Amanda Fricker, a WISSARD principal investigator and a professor of geophysics at Scripps, who initially discovered Subglacial Lake Whillans in 2007 from satellite data said: “It is amazing to think that we did not know that this lake even existed until a decade ago. It is exciting to see such a rich dataset from the lake, and these new data are helping us understand how lakes function as part of the ice-sheet system.”
Understanding and quantifying this, and similar, systems, she added, requires training a new generation of scientists who can cross disciplinary boundaries, as exemplified by the WISSARD project.
Sleeping bearded dragon (Pogona vitticeps). Credit: MPI f. Brain Research/ S. Junek
Behavioural sleep is ubiquitous among animals, from insects to man. In humans, sleep is also characterized by brain activity: periods of slow-wave activity are each followed by short phases of Rapid-Eye-Movement sleep (REM sleep). These electrical features of brain sleep, whose functions are not well understood, have so far been described only in mammals and birds, but not in reptiles, amphibians or fish. Yet, birds are reptiles–they are the feathered descendants of the now extinct dinosaurs. How then did brain sleep evolve? Gilles Laurent and members of his laboratory at the Max Planck Institute for Brain Research in Frankfurt, Germany, describe for the first time REM and slow-wave sleep in a reptile, the Australian dragon Pogona vitticeps. This suggests that brain sleep dates back at least to the evolution of the amniotes, that is, to the beginning of the colonization of terrestrial landmass by vertebrate animals.
Birds, reptiles and mammals are all amniotes, a clade of tetrapod vertebrates, whose eggs could survive outside water, hence enabling land colonization. Amniotes appeared ~320 million years ago, and quickly bifurcated into a group that led to the mammals (including us humans), and another that led to the reptiles and the birds. Bearded dragons are a type of lizard that branched out of the common reptilian trunk some 250 million years ago, much earlier than the branch that would lead to the dinosaurs and the birds. A phenomenon observed in a lizard, a bird and a mammal would thus most likely have existed in their common ancestor.
Gilles Laurent and his group study the reptilian brain because of its simpler, ancestral design, to understand cortical function, dynamics and computation. In the midst of one of these studies, they observed that brain activity recorded from resting lizards during the night oscillated regularly between two states. The present work derives from this initial observation. They asked: are we seeing REM and slow-wave sleep?
Answering this question requires classifying neuronal activity patterns recorded from the brain, based on a number of statistical, dynamical and anatomical features and correlating them with observable behaviours, such as the presence or absence of rapid eye movements.
In their report, Laurent and his colleagues describe the existence of REM and slow-wave sleep in the Australian dragon, with many common features with mammalian sleep: a phase characterized by low frequency/high amplitude average brain activity and rare and bursty neuronal firing (slow-wave sleep); another characterized by awake-like brain activity and rapid eye movements. Another common feature with mammalian sleep was the coordinated activity of cortex with another area during slow-wave sleep: in dragons this other area is the so-called dorsal ventricular ridge. In mammals it is the hippocampus.
They also report interesting differences: for example, lizard sleep rhythm is extremely regular and fast: the lizard’s sleep cycle is about 80 seconds long at 27oC, vs. 30 minutes in cat or 60-90 minutes in humans. Also, while in lizards slow-wave and REM-sleep have roughly equal durations during each cycle, REM is much shorter then slow-wave sleep in mammals, and both short and irregular in birds. Overall, lizard sleep seems a lot simpler and may thus be closer to the ancestral mode of brain sleep.
How does one know that such evidence points to a common origin, rather than separate but convergent evolution of sleep in reptiles, birds and mammals? “Positing convergent evolution (two or three times in amniote evolution) of a complex phenomenon such as sleep brain dynamics is a lot less plausible than imagining a common origin. Given the early branching out of the reptiles, additional evidence from several of reptilian branches such as turtles, lizards, or crocodiles will only increase the probability that we are looking at a common origin. The evidence, thus far, points to an origin of REM and slow-wave sleep at least as far back as the common ancestor of reptiles, birds and mammals, which lived about 320 million years ago,” explains Laurent. At that time the earth’s continents formed a single landmass.
The scientists will continue to explore brain activity during sleep and awake states, as a means to understand the common and essential features of vertebrate brain function.
Reference:
M. Shein-Idelson, J. M. Ondracek, H.-P. Liaw, S. Reiter, G. Laurent. Slow waves, sharp waves, ripples, and REM in sleeping dragons. Science, 2016; 352 (6285): 590 DOI: 10.1126/science.aaf3621
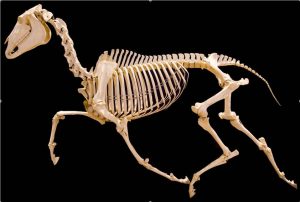
Representative Image: Trotting Horse Mount This skeleton of Lee Axworthy, the first trotting stallion to break the two-minute mile, was mounted by Samuel Harmsted Chubb, an anatomist and research associate at the Museum
Modern horses are expert runners. They reach top speeds using a special running gait in which they hold their back stiff as they move. A new study published today reveals that tiny fossil ancestors of modern horses may have moved quite differently to their living counterparts.
“Horses provide a perfect case-study on the evolution of running because they have such an amazing fossil record,” explains author Dr. Katrina Jones, a post-doctoral researcher in Harvard’s Museum of Comparative Zoology. Dating back over 50 million years, the oldest horse ancestors were no bigger than a house cat. From those ancient horse ancestors, some lineages evolved larger sizes, grazing habit and limbs that were specialized for running. This new study suggests that the stiff-backed gait of modern horses likely evolved to save energy while running as horses got bigger through their evolution.
“For over a century, researchers studied the feet of fossil horses to explain how they evolved features specialized for running,” explains Jones, “but very little is known about how the backbone might be involved in this famous transition.” Four-legged mammals tend to move their lower back during running to help increase speed and regulate breathing. But horses are unusual because they restrict the motion of their lumbar spine to a single joint near their rump. Jones wanted to find out if this unusual pattern was shared by extinct horses, and how increasing size in horse evolution may have affected their back mobility and running style.
To understand the evolution of the back in fossil horses, Jones first examined the anatomy and mobility of the spine in modern domestic horses. The shape of the vertebral joints–bony connections between the vertebrae–help determine how much motion occurs at each joint. Armed with this information, Jones then measured the shape of vertebral joints in 16 species of fossil horses spanning their full size and age range.
She found that small fossil horses, such as Hyracotherium (the ‘dawn horse’), had quite different anatomy of the vertebral joints than their modern equivalents. This anatomy suggests more mobility was possible in the middle and lower portions of their back. Anatomy of these joints was also linked to body size–evolutionary branches which evolved greater size tended to display more restrictive joints. Jones hypothesizes that stability of the backbone evolved as a response to the mechanical challenge of large size in horses. Says Jones,”the energy required for a large animal to move at high speed can be extreme, so increasing running efficiency by minimizing motions of the trunk makes sense.”
Jones speculates that these tiny ancient horses may not have been running in the same way as modern horses. Some living mammals can switch between stiff-backed and flex-backed running as they increase in speed. This could be one potential model for the evolution of specialized stiff-backed running in horses. This study reveals a new insight into a famous case-study of locomotor adaptation. Jones explains: “the findings are significant because they show how the backbone–a relatively understudied part of the anatomy–can provide new perspectives on locomotor transitions.”
Reference:
Katrina Elizabeth Jones. New insights on equid locomotor evolution from the lumbar region of fossil horses. Proceedings of the Royal Society B: Biological Sciences, 2016; 283 (1829): 20152947 DOI: 10.1098/rspb.2015.2947
Note: The above post is reprinted from materials provided by Harvard University.
Rainwater may play an important role in the process that triggers earthquakes, according to new research.
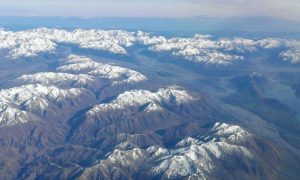
Researchers from the University of Southampton, GNS Science (New Zealand), the University of Otago, and GFZ Potsdam (Germany), identified the sources and fluxes of the geothermal fluids and mineral veins from the Southern Alps of New Zealand where the Pacific and Australian Plates collide along the Alpine Fault.
From careful chemical analyses, they discovered that fluids originating from the mantle, the layer below the Earth’s crust, and fluids derived from rainwater, are channelled up the Alpine Fault.
By calculating how much fluid is flowing through the fault zone at depth, the researchers showed for the first time that enough rainwater is present to promote earthquake rupture on this major plate boundary fault.
Lead researcher Dr Catriona Menzies, from Ocean and Earth Science at the University of Southampton, said: “Large, continental-scale faults can cause catastrophic earthquakes, but the trigger mechanisms for major seismic events are not well known. Geologists have long suspected that deep groundwaters may be important for the initiation of earthquakes as these fluids can weaken the fault zones by increasing pressures or through chemical reactions.
“Fluids are important in controlling the evolution of faults between earthquake ruptures. Chemical reactions may alter the strength and permeability of rocks, and if enough fluid is present at sufficiently high pressures they may aid earthquake rupture by ‘pumping up’ the fault zone.”
The Alpine Fault is a major strike-slip fault, like the San Andreas, that fails in very large (Magnitude 8+) earthquakes around every 300 years. It last ruptured in 1717 AD and consequently it is under intense scientific scrutiny because it is a rare example of a major fault that is late in the strain-build up before rupture.
Dr Menzies said: “We show that the Alpine Fault acts as a barrier to lateral fluid flow from the high mountains of the Southern Alps towards the Tasman Sea in the west. However, the presence of mantle-derived fluids indicates that the fault also acts as a channel for fluids, from more than 35 km depth, to ascend to the surface.
“As well as mantle derived fluids, our calculations indicate that 0.02-0.05 per cent of surface rainfall reaches around six kilometres depth but this is enough to overwhelm contributions from the mantle and fluids generated during mountain-building by metamorphic reactions in hot rocks. This rainwater is then focused onto the fault, forced by the hydraulic head of the high mountains above and the sub-vertical fluid flow barrier of the Alpine Fault.”
Funding for this research, published in Earth and Planetary Science Letters, was provided by the Natural Environmental Research Council (NERC), Deutsche Forschungsgemeinschaft, and GNS Science (New Zealand).
Reference:
The fluid budget of a continental plate boundary fault: Quantification from the Alpine Fault, New Zealand, Earth and Planetary Science Letters, Dr Catriona Menzie et al., DOI: 10.1016/j.epsl.2016.03.046
Scripps scientists Lisa Levin and Carlos Neira preparing a sediment coring instrument for deployment on the seafloor. Credit: Image courtesy of University of California – San Diego
A new study found that vulnerability of deep-sea biodiversity to climate change’s triple threat — rising water temperatures, and decreased oxygen, and pH levels — is not uniform across the world’s oceans.
The analysis by researchers at Scripps Institution of Oceanography at University of California San Diego used responses to natural variation in temperature, oxygen, and pH to reveal that deep-sea biodiversity from Baja California to San Francisco may be highly susceptible to projected climate changes in the future.
Climate change is often thought of as a single environmental threat from increases in atmospheric CO2. However, multiple climate stressors, from ocean warming and acidification to low oxygen levels, are expected to result in cumulative impacts on marine life. The deep ocean, which covers more than 60 percent of Earth’s surface, is a biodiversity hotspot at increased risk from climate change.
The National Science Foundation-funded study, published in the April 27 issue of the journal Proceedings of the Royal Society B, looked at how marine communities change across natural gradients to better understand the influence of the three climate stressors.
“These stressors are often under-appreciated threats to diversity and ecosystem health,” said Scripps biological oceanographer Lisa Levin, the senior author of the study. “Yet, they raise questions about whether, and how, populations will adapt and which stressors are the primary drivers.”
To untangle the impacts that these three climate stressors will have on seafloor diversity in the future, the researchers examined existing published data and collected new data on organisms living in deep-sea sediments in upwelling regions along continental margins, where the ocean and continental crusts meet along the seafloor. The researchers found that organisms from each ocean basin had its own unique threshold for the level and type of stressor it could tolerate.
The researchers found that diversity of marine life in the eastern Pacific Ocean is highly sensitive to declining oxygen levels, while CO2 levels were of importance to biodiversity in the Indian Ocean. Oxygen levels are falling throughout the world’s oceans, and the decline is expected to have the greatest impact to biodiversity in the eastern Pacific Ocean.
“Global change affects so many different environmental aspects, and across such a range of conditions, that it can be difficult to study in the laboratory,” said Erik Sperling, assistant professor of geological sciences at Stanford’s School of Earth, Energy & Environmental Sciences, lead author of the study, which was conducted while he was a postdoctoral researcher at Scripps. “In some sense nature has already run these experiments on continental margins, where sharp natural environmental gradients exist.”
Continental margins cover over 11 percent of the world’s oceans. They are considered biodiversity hotspots and play a major role in supporting commercially important fisheries. They are also considered the largest “carbon sink” of atmospheric carbon dioxide on Earth.
The results from the study can help better identify areas under the most stress, and to predict the regions most susceptible to future climate change.
Reference:
Erik A. Sperling, Christina A. Frieder, Lisa A. Levin. Biodiversity response to natural gradients of multiple stressors on continental margins. Proceedings of the Royal Society B: Biological Sciences, 2016; 283 (1829): 20160637 DOI: 10.1098/rspb.2016.0637
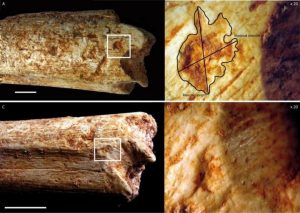
Tooth-marks on a 500,000-year-old hominin femur bone found in a Moroccan cave indicate that it was consumed by large carnivores, likely hyenas, according to a study published April 27, 2016 in the open-access journal PLOS ONE. Credit: C. Daujeard PLOS ONE e0152284
Tooth-marks on a 500,000-year-old hominin femur bone found in a Moroccan cave indicate that it was consumed by large carnivores, likely hyenas, according to a study published April 27, 2016 in the open-access journal PLOS ONE by Camille Daujeard from the Muséum National D’Histoire Naturelle, France, and colleagues.
During the Middle Pleistocene, early humans likely competed for space and resources with large carnivores, who occupied many of the same areas. However, to date, little evidence for direct interaction between them in this period has been found. The authors of the present study examined the shaft of a femur from the skeleton of a 500,000-year-old hominin, found in the Moroccan cave “Grotte à Hominidés” cave near Casablanca, Morocco, and found evidence of consumption by large carnivores.
The authors’ examination of the bone fragment revealed various fractures and tooth marks indicative of carnivore chewing, including tooth pits as well as other scores and notches. These were clustered at the two ends of the femur, the softer parts of the bone being completely crushed. The marks were covered with sediment, suggesting that they were very old.
While the appearance of the marks indicated that they were most likely made by hyenas shortly after death, it was not possible to conclude whether the bone had been eaten as a result of predation on the hominin or had been scavenged soon after death. Nonetheless, this is the first evidence that humans were a resource for carnivores during the Middle Pleistocene in this part of Morocco, and contrasts with evidence from nearby sites that humans themselves hunted and ate carnivores. The authors suggest that depending on circumstances, hominins at this time could have both acted as hunter or scavenger, and been targeted as carrion or prey.
Camille Daujeard notes: “Although encounters and confrontations between archaic humans and large predators of this time period in North Africa must have been common, the discovery … is one of the few examples where hominin consumption by carnivores is proven.”
Reference:
Camille Daujeard, Denis Geraads, Rosalia Gallotti, David Lefèvre, Abderrahim Mohib, Jean-Paul Raynal, Jean-Jacques Hublin. Pleistocene Hominins as a Resource for Carnivores: A c. 500,000-Year-Old Human Femur Bearing Tooth-Marks in North Africa (Thomas Quarry I, Morocco). PLOS ONE, 2016; 11 (4): e0152284 DOI: 10.1371/journal.pone.0152284
Note: The above post is reprinted from materials provided by PLOS.
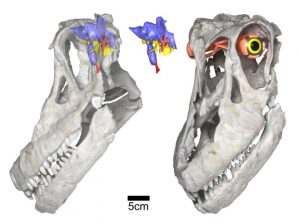
Sarmientosaurus head posture, brain & eye (WitmerLab): Digital renderings of the skull and reconstructed brain endocast and eye of the new titanosaurian dinosaur species Sarmientosaurus musacchioi. At left is the skull rendered semi-transparent in left side view, showing the relative size and position of the brain endocast (in blue, pink, yellow, and red) and the inferred habitual head posture. At center is the isolated brain endocast in left side view, and at right is a left/front view of the skull showing the reconstructed eyeball and its associated musculature. Scale bar equals five centimeters. Credit: WitmerLab, Ohio University
Scientists have discovered Sarmientosaurus musacchioi, a new species of titanosaurian dinosaur, based on an complete skull and partial neck fossil unearthed in Patagonia, Argentina, according to a study published April 26, 2016 in the open-access journal PLOS ONE by Rubén Martínez from the Laboratorio de Paleovertebrados of the Universidad Nacional de la Patagonia San Juan Bosco (UNPSJB), Argentina, and colleagues.
Titanosaurs, a type of sauropod, ranged in size from the weight of a cow to that of the largest sperm whale. These plant-eaters have long necks and tails and may have been the most common large herbivores in the Southern Hemisphere landmasses during the Cretaceous. Despite their abundance, the skulls of these animals, critical to deciphering certain aspects of their biology, are exceedingly rare. Of the 60-plus named titanosaurs, only four are represented by nearly complete or semi-complete skulls. Using computerized tomography (CT) imaging, the authors of this study closely examined well-preserved, anatomically ‘primitive’ skull and neck fossils from Sarmientosaurus.
The researchers found that the Sarmientosaurus brain was small relative to its enormous body, typical of sauropods. However, they also found evidence of greater sensory capabilities than most other sauropods. They suggest that Sarmientosaurus had large eyeballs and good vision, and that the inner ear may have been better tuned for hearing low-frequency airborne sounds compared to other titanosaurs. Moreover, the balance organ of the inner ear indicates that this dinosaur may have habitually held its head with the snout facing downward, possibly to feed primarily on low-growing plants. “Discoveries like Sarmientosaurus happen once in a lifetime,” says study leader Rubén Martínez. “That’s why we studied the fossils so thoroughly, to learn as much about this amazing animal as we could.”
Sarmientosaurus musacchioi is named for the town of Sarmiento in Chubut Province, which is close to the discovery site. The species name also honors the late Dr. Eduardo Musacchio, a paleontologist and professor at the UNPSJB and friend to Dr. Martínez and other team members.
Reference:
Rubén D. F. Martínez, Matthew C. Lamanna, Fernando E. Novas, Ryan C. Ridgely, Gabriel A. Casal, Javier E. Martínez, Javier R. Vita, Lawrence M. Witmer. A Basal Lithostrotian Titanosaur (Dinosauria: Sauropoda) with a Complete Skull: Implications for the Evolution and Paleobiology of Titanosauria. PLOS ONE, 2016; 11 (4): e0151661 DOI: 10.1371/journal.pone.0151661
Note: The above post is reprinted from materials provided by PLOS.
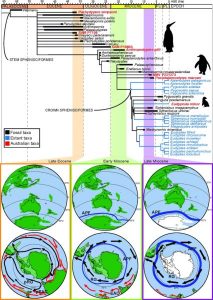
Stratigraphically calibrated phylogeny of Sphenisciformes correlated with tectonic movements and changing ocean circulation in the southern hemisphere showing how: (1) the Australian taxa are dispersed across the phylogeny temporally; (2) the Australian continent becomes progressively more isolated from other southern continents; and (3) a strengthened ACC (indicated by the black arrows) provides a new dispersal vector to Australia despite the presence of a strengthening Antarctic Polar Front (APF). The bottom palaeomaps are based on reconstructions in Lawver & Gahagan [9]. Penguin silhouettes show overall trend for decreasing body size in penguin evolution: Top, archaic giant stem penguin taxa; middle medium-sized stem penguin taxa; bottom, smaller crown penguin taxa (silhouette credit: Fir0002/Flagstaffotos (original photo), John E. McCormack, Michael G. Harvey, Brant C. Faircloth, Nicholas G. Crawford, Travis C. Glenn, Robb T. Brumfield & T. Michael Keesey, used under a CC BY 3.0 Attribution Unported Licence (http://creativecommons.org/licenses/by/3.0/))). Palaeoceanographic reconstructions after [9,72-74]. Palaeoceanographic abbreviations: EAC = East Australian Current, pEAC = palaeo-East Australian Current, pRG = palaeo-Ross Sea Gyre/Tasman Current, RG = Ross Sea Gyre. The relative strength of the ACC and APF is shown by thickening arrows and lines though time. Black arrow = cold currents, red arrows = warm currents. Credit: Park et al.; CCALMultiple dispersals of penguins reached Australia after the continent split from Antarctica, including ‘giant penguins’ that may have lived there after they went extinct elsewhere, according to a study published April 26, 2016 in the open-access journal PLOS ONE by Travis Park from Monash University, Australia, and colleagues.
Penguin evolution in Australia following the continent’s pre-historic split from Antarctica is not well-understood, but the fossil record shows that Australia was home to a number of penguin species. Only the little penguin remains today, and pre-Quarternary evidence of this species and its ancestors in Australia is lacking. To update our understanding of Australian penguin evolutionary history, the authors of the study analysed recently collected penguin fossils and compared them to known species, including now-extinct ‘giant penguins,’ and presented a new phylogenetic tree in the context of biogeographical events on the Australian continent.
The authors propose that Australia’s unique biogeographical history allowed for multiple dispersals of penguins to the continent during the Cenezoic or Age of Mammals, and that ancestors of the modern little penguins arrived in Australia with the help of a strengthened Antarctic Circumpolar Current.
While evolutionary trees are constructed as best estimates based on sometimes-limited fossil records, the authors suggest these findings shed new insights into the evolutionary trajectory of penguins in Australia.
Reference:
Travis Park, Erich M. G. Fitzgerald, Stephen J. Gallagher, Ellyn Tomkins, Tony Allan. New Miocene Fossils and the History of Penguins in Australia. PLOS ONE, 2016; 11 (4): e0153915 DOI: 10.1371/journal.pone.0153915
Note: The above post is reprinted from materials provided by PLOS.
The Condominio Alto Rio, a high-rise apartment building in Concepcion, Chile, collapsed as a result of the magnitude 8.8 earthquake on Feb. 27, 2010. The building, one of the damaged structures detailed in a new database within the NIST Disaster and Failure Studies Data Repository, broke from its foundation, toppled over and split in half as it hit the ground. Credit: Walter D. Mooney/U.S. Geological Survey
Feb. 27, 2010, is a date that most Chileans will probably never forget. On that day, the sixth strongest earthquake in recorded history—packing a force greater than the most powerful thermonuclear device ever tested—occurred off the country’s central coast. Now, thanks to a newly available set of data collected in the aftermath of the disaster, the National Institute of Standards and Technology (NIST) is providing Chile and other quake-prone areas worldwide with a powerful tool toward becoming more resilient to future seismic events.
The massive shockwaves and accompanying tsunami of the 2010 Maule, Chile, earthquake (magnitude 8.8) killed more than 300 people, affected nearly 2 million others, and damaged or destroyed approximately half a million homes, schools, hospitals and other buildings. Following the event, an interdisciplinary team of researchers, including a NIST engineer, documented the devastation and chronicled the response of hundreds of structures. The comprehensive collection of this valuable information is now accessible as the newest addition to the NIST Disaster and Failure Studies Data Repository.
The repository was established in 2011 to provide a place where data collected during and after a major disaster or structural failure, as well as data generated from related research, could be organized and maintained to facilitate study, analysis and comparison with future events. Eventually, NIST hopes that the repository will serve as a national archival database where other organizations can store the research, findings and outcomes of their disaster and failure studies.
Initially, the NIST Disaster and Failure Studies Data Repository was established to house data from the agency’s six-year investigation of the collapses of three buildings at New York City’s World Trade Center (WTC 1, 2 and 7) as a result of the terrorist attacks on Sept. 11, 2001. With the addition of the 2010 Chile earthquake dataset, NIST is broadening the scope of the repository to begin making it a larger collection of information on hazard events such as earthquakes, hurricanes, tornadoes, windstorms, community-scale fires in the wildland urban interface, storm surges and man-made disasters (accidental, criminal or terrorist).
“Users can search the database by building names, design features, construction types, and uses and occupancies,” says Long Phan, acting director of the NIST Disaster and Failure Studies Program.
Next to be added to the repository will be data from the NIST investigation of the impacts of the May 22, 2011, tornado that struck Joplin, Missouri, and the NIST report that documents impacts of the May 20, 2013, tornado in the Newcastle-Moore area of Oklahoma.
By making the data available online, NIST hopes to support the development of standards, codes, practices and new technologies that improve community resilience against the threat of disasters. As the repository grows, it will include data on significant hazard events; how buildings and other structures performed during those events; associated emergency response and evacuation procedures; and the technical, social and economic factors that affect pre-disaster mitigation activities and post-disaster response efforts.
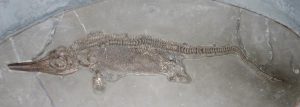
A new study has identified two new specimens of a rare ancient marine reptile, and has for the first time revealed the pelvis bones of the species.
Ichthyosaurs were reptiles that lived in the ocean while dinosaurs – their cousins – walked on land. A similar shape to dolphins and sharks, they evolved many millions of years before the first dinosaurs appeared. The first specimens were found in England in 1821, and were named Ichthyosaurus by palaeontologists Henry De la Beche and William Conybeare. In 1888, British scientist Richard Lydekker described a new species of ichthyosaur found in Jurassic rocks off the coast of Dorset, and called this species Ichthyosaurus conybeari in honour of Conybeare.
This small-bodied species is the rarest of the currently recognised species of Ichthyosaurus, and was previously known only from two specimens.
The key specimen of this study was collected in the 1980s from Jurassic rocks along the Watchet coast at Doniford Bay, Somerset. It was later acquired by the National Museum of Wales, Cardiff, where the specimen was first put on display in the early 1990s. It had been on display ever since, but had remained unstudied.
Dean Lomax, expert presenter on ITV’s Dinosaur Britain and Honorary Scientist at The University of Manchester, first examined the specimen in 2013 with Professor Judy Massare of the SUNY Brockport College, New York, USA.
The small, almost complete skeleton measures no more than 87cm, and due to its size, was previously thought to be a juvenile of an existing species. However, the identification of the specimen as Ichthyosaurus conybeari enabled a thorough review of that species and the identification of new features previously unreported.
Dean said: “Palaeontologists make discoveries in the field, the laboratory and behind the scenes in museums, but this came as a surprise as it was on display and had been missed. The coolest thing about this specimen is that the pelvis is preserved – the pelvis of this species was unknown, and is completely different to any other species of Ichthyosaurus.”
“This species was poorly understood, and our study has doubled the number of specimens known. The identification of the new specimens has allowed us to trace the geological range of the species from around 195 to 189 million years – the longest range of any species of the genus.” Dean added.
The research has been published today in the Journal of Vertebrate Paleontology.
Reference:
Judy A. Massare et al. A new specimen of (Reptilia, Ichthyosauria) from Watchet, Somerset, England, U.K., and a re-examination of the species , Journal of Vertebrate Paleontology (2016). DOI: 10.1080/02724634.2016.1163264
New research from The University of Texas at Arlington demonstrates that groundwater quality changes alongside the expansion of horizontal drilling and hydraulic fracturing but also suggests that some potentially hazardous effects may dissipate over time.
The new research, published today in the journal Science of the Total Environment in the article “Temporal Variation in Groundwater Quality in the Permian Basin of Texas, a Region of Increasing Unconventional Oil and Gas Development,” is the first to analyze groundwater quality in the Cline Shale region of West Texas before, during and after the expansion of hydraulic fracturing and horizontal drilling.
The research team collected and analyzed private water well samples on the eastern shelf of the Permian Basin four times over 13 months to monitor basic water quality, metal ions, organic ions and other chemicals. They discovered the presence of chlorinated solvents, alcohols and aromatic compounds exclusively after multiple unconventional oil wells had been activated within five kilometers of the sampling sites. Large fluctuations in pH and total organic carbon levels also were detected in addition to a gradual accumulation of bromide.
“These changes and levels are abnormal for typical groundwater quality,” said Kevin Schug, lead author of the study and UTA’s Shimadzu Distinguished Professor of Analytical Chemistry and director of the University’s Collaborative Laboratories for Environmental Analysis and Remediation, or CLEAR lab.
“The results also suggest that contamination from unconventional drilling may be variable and sporadic, not systematic, and that some of the toxic compounds associated with areas of high unconventional drilling may degrade or become diluted within the aquifer over time,” Schug said. “The next step is more research to precisely quantify and understand contamination cycles as well as to understand aquifer resilience to pollutants.”
The results also indicated that contamination pathways are complex. Various toxic compounds were detected in groundwater seemingly at random times in areas of high drilling activity.
“A collaborative effort with an oil and gas industry leader would better help us trace these occurrences, as well as focus on understanding the fate of specific recipes of proprietary chemicals,” Schug added.
Morteza Khaledi, dean of UTA’s College of Science, said the research enhances understanding of the potential impact drilling can have on groundwater while showing that those effects can diminish over time. The work supports UTA’s focus on research with global environmental impact, one of the four core themes of the University’s Strategic Plan 2020: Bold Solutions | Global Impact.”
“Clarifying misconceptions about the environmental effects of these new drilling technologies is vital to us all,” Khaledi said. “CLEAR and Dr. Schug have a particularly strong history of research in this area.”
The new paper, developed in collaboration with the University of North Texas, Baylor University and sampling firm Inform Environmental LLC, comes on the heels of two other recent studies, “A Comprehensive Analysis of Groundwater Quality in the Barnett Shale Region” published in Environmental Science & Technology in 2015, and “Elucidating Hydraulic Fracturing Impacts on Groundwater Quality using a Regional Geospatial Statistical Modeling Approach” in Science of the Total Environment, in 2016. Both studies discussed the detection of unconventional drilling-related abnormalities in the groundwater overlying the Barnett Shale in the Fort Worth Basin.
UTA’s CLEAR laboratories previously discovered beryllium concentrations in groundwater that could be associated with contamination from hydraulically fractured gas wells by way of structural failures in protective well casing. They also found elevated levels of 10 different metals as well as the presence of 19 different chemicals compounds including so-called BTEX (benzene, toluene, ethyl benzene and xylenes) compounds associated with hydraulic fracturing, as well as elevated levels of methanol and ethanol.
As early as 2013, an initial study of 100 private water wells in and near the Barnett Shale showed elevated levels of potential contaminants such as arsenic and selenium closest to natural gas extraction sites.
“CLEAR is running multiple research projects aimed to help the scientific community, the industry, and most importantly, the public, understand the potential effects of unconventional oil and gas development on the environment,” Schug said. “We are dealing with complex processes in complex and variable environments. It is our goal to develop and apply methods that provide reliable information about a wide variety of chemical constituents.”
Schug said it also is important to consider what can be done once a problem is found. CLEAR is dedicated to the development of remediation technologies and best management practices to effectively handle and decrease the occurrence of contamination events. Means for remediating contaminated water and soil are currently being tested in the laboratory and in field applications.
A new study suggests that volcanic eruptions did not lead to the extinction of the dinosaurs, and also demonstrates that Earth’s oceans are capable of absorbing large amounts of carbon dioxide—provided it is released gradually over an extremely long time.
Scientists have long argued over the cause of the Cretaceous-Palaeogene extinction event, during which three-quarters of all plant and animal species, including the dinosaurs, went extinct roughly 65 million years ago. Most researchers favor the idea that a catastrophic, sudden mechanism such as an asteroid hit triggered the mass die-off, while others say a gradual rise in CO2 emissions from volcanoes in what is now India may have been the cause.
Scientists at Yale and in the United Kingdom say they may have a more definitive answer.
“One way that has been suggested that volcanism could have caused extinction is by ocean acidification, where the ocean absorbs CO2 and becomes more acidic as a result, just as it is doing today with fossil fuel-derived CO2,” said Michael Henehan, a postdoctoral associate at Yale and lead author of a study appearing April 25 in the journal Philosophical Transactions of the Royal Society B.
“What we wanted to do was gather all the evidence that’s been collected from ocean sediments from this time and add a few new records of our own, and consider what evidence there is for ocean acidification at this time,” Henehan said.
Henehan and his colleagues analyzed sediments from the deep sea, looking for signs of dissolution that would indicate more acidic oceans. The researchers found that the onset of volcanism did cause a brief ocean acidification event. Critically, though, the pH drop caused by CO2 release was effectively neutralized well before the mass extinction event.
“Combining this with temperature observations that others have made about this time, we think there is a conclusive case that although Deccan volcanism caused a short-lived global warming event and some ocean acidification, the effects were cancelled out by natural carbon cycling processes long before the mass extinction that killed the dinosaurs,” Henehan said.
This is not to say that CO2 released by volcanoes did not prompt climate effects, the researchers noted: Rather, the gases were released over such a long timescale their effect could not have caused a sudden, species die-off.
The study also has implications for understanding modern climate change, the researchers noted. They said it adds to an increasing body of work that suggests restricting CO2 release to much slower and lower levels over thousands of years can allow the oceans to adapt and avoid the worst possible consequences of ocean acidification.
“However, if you cause big disturbances over rapid timescales, closer to the timescales of current human, post-industrial CO2 release, you can produce not only big changes in oceanic ecosystems, but also profound and long-lasting changes in the way the ocean stores and regulates CO2,” Henehan said.
The researchers said their work also suggests that disruption of marine ecosystems can have profound effects on Earth’s climate.
“The direct effects of an asteroid impact, like massive tsunamis or widespread fires, would have lasted only for a relatively short time,” said co-author Donald Penman, a postdoctoral associate at Yale. “However, the loss of ecologically important groups of organisms following impact caused changes to the global carbon cycle that took millions of years to recover. This could be seen as a warning for our future: We need to be careful not to drive key functional organisms to extinction, or we could be feeling the effects for a very long time.”
Reference:
Michael J. Henehan et al. Biogeochemical significance of pelagic ecosystem function: an end-Cretaceous case study, Philosophical Transactions of the Royal Society B: Biological Sciences (2016). DOI: 10.1098/rstb.2015.0510
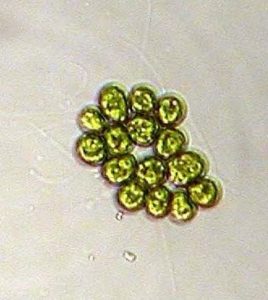
Gonium pectorale (photograph from the Volvocales Information Project by Aurora Nedelcu). Credit: The Volvocales Information Project by Aurora Nedelcu
Throughout the history of life on Earth, multicellular life evolved from single cells numerous times, but explaining how this happened is one of the major evolutionary puzzles of our time. However, scientists have now completed a study of the complete DNA of one of the most important model organisms, Gonium pectorale, a simple green algae that comprises only 16 cells.
This microscopic organism is helping to fill the evolutionary gap in our understanding. The two year research project was a global collaboration between Kansas State University, Universities of Arizona and Tokyo, and Wits University. It is documented in the journal Nature Communications.
Pierre Durand, a researcher in the department of Molecular Medicine and Haematology and the Evolutionary Studies Institute at Wits University is one of the project collaborators.
“The evolution from unicellular to multicellular life was a big deal. It changed the way the planet would be forever. From worms to insects, the dinosaurs, grasses, flowering plants, hadedas and humans, you just have to look around and see the extraordinary forms of multicellular existence,” says Durand.
“It has been difficult to explain how this occurred because it was not an easy thing to have happened. So questions like ‘why did single cells live together in groups at the very beginning of multicellularity when it puts them at a fitness disadvantage?’ challenged us for a long time,” says Durand. We still don’t know most of the answers but this project has certainly filled one of the gaps in our current understanding.
There are many model systems for studying multicellularity but nothing quite like the volvocine green algae, the group to which G. pectorale belongs.
“The evolutionary transition to multicellularity has occurred numerous times in all domains of life, yet the evolutionary history of this transition is not well understood. However, the volvocine green algae include a diverse variety of unicellular, colonial, and multicellular species,” says Durand.
There are many members of the volvocines with varying degrees of complexity, so it is possible to examine different stages on the road to multicellularity. The volvocines also evolved relatively recently (during the Triassic period about the time when the first dinosaurs appeared) and the mysteries of multicellularity are not lost in evolutionary time.
Reporting on the genome sequencing of Gonium pectorale, the scientists uncovered some of the genes that regulate cellular growth and division in this organism. This finding helps explain how single cells live together in groups — one of the earliest steps on the path to a multicellular existence.
Reference:
Erik R. Hanschen, Tara N. Marriage, Patrick J. Ferris, Takashi Hamaji, Atsushi Toyoda, Asao Fujiyama, Rafik Neme, Hideki Noguchi, Yohei Minakuchi, Masahiro Suzuki, Hiroko Kawai-Toyooka, David R. Smith, Halle Sparks, Jaden Anderson, Robert Bakarić, Victor Luria, Amir Karger, Marc W. Kirschner, Pierre M. Durand, Richard E. Michod, Hisayoshi Nozaki, Bradley J. S. C. Olson. The Gonium pectorale genome demonstrates co-option of cell cycle regulation during the evolution of multicellularity. Nature Communications, 2016; 7: 11370 DOI: 10.1038/ncomms11370
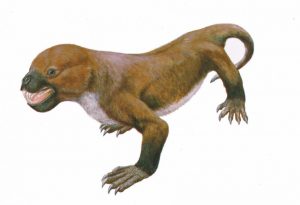
Tritylodontids are the last known family of near-mammalian reptiles, before mammals with features such as advanced hearing evolved. Researchers have uncovered dozens of fossilized teeth in Kuwajima, Japan and identified this as a new species of tritylodontid. This suggests that tritylodontids co-existed with some of the earliest mammal species for millions of years. Credit: Seishi Yamamoto/Hiroshige Matsuoka
Teeth can reveal a lot, such as how the earliest mammals lived with their neighbors. Researchers have uncovered dozens of fossilized teeth in Kuwajima, Japan and identified this as a new species of tritylodontid, an animal family that links the evolution of mammals from reptiles. This finding suggests that tritylodontids co-existed with some of the earliest mammal species for millions of years, overturning beliefs that mammals wiped out mammal-like reptiles soon after they emerged.
Tritylodontids are the last known family of near-mammalian reptiles, before mammals with features such as advanced hearing evolved.
“Tritylodontids were herbivores with unique sets of teeth which intersect when they bite,” explains study author Hiroshige Matsuoka, based at Kyoto University. “They had pretty much the same features as mammals — for instance they were most likely warm-blooded — but taxonomically speaking they were reptiles, because in their jaws they still had a bone that in mammals is used for hearing.”
While excavating a geologic layer from the Cretaceous era in Kuwajima, researchers found fossils of dinosaurs, turtles, lizards, fish, many types of plants, and Mesozoic mammals. Among these were more than 250 tritylodontid teeth, the first to be found in Japan.
Tritylodontids lived in the Jurassic era and proliferated worldwide, but were thought to have died out as herbivorous mammals took over their ecological role in the late Jurassic. “This made sense, because otherwise tritylodontids and the herbivorous mammals would have competed for the same niche,” says Matsuoka.
But according to the team’s finding, trytylodontids seem to have survived at least 30 million years longer than what paleontologists had believed.
“This raises new questions about how tritylodontids and their mammalian neighbors shared or separated ecological roles,” says Matsuoka.
The study is also the first of its kind to depend solely on details from teeth to determine whether the species is new, and also where it sits on the evolutionary tree.
“Usually fossils are identified as a new species only when a relatively complete set of structures like a jaw bone are found. In these cases, characteristics of teeth tend to be described only briefly,” adds Matsuoka. “Tritylodontid teeth have three rows of 2-3 cusps. This time we paid attention to fine details like the size and shape of each cusp. By using this method it should be possible to characterize other species on the evolutionary tree as well.”
“Because fossils of so many diverse families of animals are to be found in Kuwajima, we’d like to keep investigating the site to uncover things not just about individual species, but also about entire ecological dynamics.”
Reference:
Hiroshige Matsuoka, Nao Kusuhashi, Ian J. Corfe. A new Early Cretaceous tritylodontid (Synapsida, Cynodontia, Mammaliamorpha) from the Kuwajima Formation (Tetori Group) of central Japan. Journal of Vertebrate Paleontology, 2016; e1112289 DOI: 10.1080/02724634.2016.1112289
Note: The above post is reprinted from materials provided by Kyoto University.
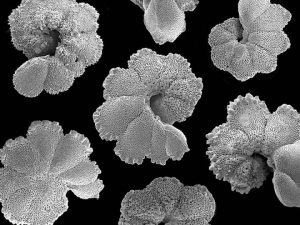
Fossil planktonic foraminifera (40 million years old) from Tanzania is shown. Credit: Paul Pearson, Cardiff University
Atmospheric carbon dioxide concentration was the major driver behind the global climatic shifts that occurred between 53 and 34 million years ago, according to new research led by the University of Southampton.
The study, which was published in Nature, is the first to resolve the relationship between carbon dioxide (CO2) and climate during the period known as the ‘Eocene epoch’ when global temperatures were around 14 oC warmer than today. This is an important step in understanding ancient climate and thus helping scientists better predict future climate change.
The UK-wide research team developed new records of past CO2 levels by analysing ancient ocean sediments. The results support the view that elevated CO2 was responsible for the extreme warmth of the early Eocene and that CO2 decline was responsible for the subsequent cooling that ultimately led to the establishment of today’s polar ice sheets.
“We cannot directly measure CO2 concentrations from that long ago,” said Dr Eleni Anagnostou, lead author and postdoctoral researcher at the University of Southampton. “Instead we must rely on indirect ‘proxies’ present in the geological record. In this study, we used the chemical composition of marine fossils preserved in sediments to reconstruct ancient CO2 levels.”
The fossils, called foraminifera, were once tiny marine creatures that lived near the ocean surface during the Eocene epoch; their shells capture the chemical makeup of the seawater they lived in.
“Fossil foraminifera have beautiful and intricate shells,” said Dr Eleanor John, postdoctoral researcher at Cardiff University, a partner in the study. “We can identify and separate the various species, including crucially those that lived in the topmost layer of the ocean, where the chemistry is controlled by atmospheric CO2.”
Applying pioneering geochemical techniques — developed at the University of Southampton over the past five years — the team used isotopes of the element boron in the shells as a proxy for pH (a measure of acidity), and used that to determine the atmospheric CO2 levels.
They found that between the early Eocene and the late Eocene, CO2 levels approximately halved. Using our current understanding of the relationship between sea surface temperature and CO2 at different latitudes, they also demonstrated that the changes in CO2 concentration can explain the majority of the cooling that occurred.
This research can also be used to gain a better understanding of how Earth will respond to increasing levels of CO2 in the future. Co-author Professor Gavin Foster, of Ocean and Earth Science at the University of Southampton, said: “After accounting for changes in vegetation and how the continents were arranged in the past, and correcting for the effect relating to the lack of ice sheets in the Eocene, we found that the sensitivity of the climate system to CO2 forcing in the warm Eocene was similar to that predicted by the IPCC for our warm future.”
Dr Anagnostou added: “This confirms that the Eocene world really was a greenhouse world, with the main difference to now being the higher CO2 level. The comparison gives us more confidence in our predictions of future climate warming in the face of rapid anthropogenic CO2 increase.”
Reference:
Eleni Anagnostou, Eleanor H. John, Kirsty M. Edgar, Gavin L. Foster, Andy Ridgwell, Gordon N. Inglis, Richard D. Pancost, Daniel J. Lunt, Paul N. Pearson. Changing atmospheric CO2 concentration was the primary driver of early Cenozoic climate. Nature, 2016; DOI: 10.1038/nature17423
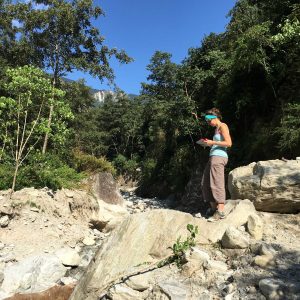
Marin Clark assessing boulders deposited during a monsoon-triggered debris flow near Timbu, Nepal. Credit: Dimitrios Zekkos
With the monsoon fast approaching, the landslide risk in Nepal remains high a year after a magnitude-7.8 earthquake that killed more than 8,000 people, according to a University of Michigan-led research team.
The April 25, 2015, earthquake struck central Nepal and was followed two weeks later by a magnitude-7.2 aftershock. Both events produced strong ground shaking in the steep terrain of the Himalaya Mountains, causing widespread landsliding.
In the past year, the U-M-led team has mapped 22,000 landslides caused by the Nepal earthquakes. The maps will be used to identify areas of continued high landslide risk, said Marin Clark, a U-M geomorphologist and geophysicist who studies tectonic movements in the Himalayas and who is an expert on landslides triggered by earthquakes.
Hillsides stripped of vegetation by earthquake-generated landslides become hotspots for further landsliding during summer monsoon rainstorms, said Clark, an associate professor in the U-M Department of Earth and Environmental Sciences.
“While last year’s monsoon was relatively mild, concern is high over what to expect this summer, if we were to have a normal or stronger-than-typical monsoon,” Clark said. “We’re releasing this new landslide inventory in time for the upcoming monsoon season so that government officials and aid organizations can use it to help a country that’s still recovering from last year’s disaster.”
With funding from the National Science Foundation, Clark and her colleagues have been studying the effects of last year’s Nepal earthquakes on the landscape by analyzing where and why the landslides occurred. They used drones during the 2015 field season to help locate and map the landslides.
Clark’s collaborators on the study include Dimitrios Zekkos of the U-M College of Engineering and Joshua West of the University of Southern California. U-M graduate students Julie Bateman and Will Greenwood participated in the fall fieldwork, and undergraduate student Kevin Roback developed the digital landslide inventory.
The highest density of Nepal landsliding, and therefore the location of highest ongoing risk, is concentrated in four large river valleys, one of which contains the main road from Nepal to China, Clark said.
During the 2015 field season, the researchers also documented evidence of monsoon-related debris flows resulting from earthquake landslides. Debris flows are fast-moving mixtures of water, soil and rock. In Nepal following last year’s earthquakes, debris flows impacted villages and temporarily blocked rivers, creating a flood risk.
U-M graduate students will head back to Nepal next month to conduct additional fieldwork. Clark will return with a team of faculty researchers and students in the fall and is coordinating with groups from Switzerland and Germany. The landslide inventory and a related research article will be submitted for publication in a peer-reviewed journal.
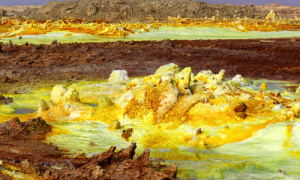
Hydrothermal system at the Danakil Depression. The yellow deposits are a variety of sulphates and the red areas are deposits of iron oxides. Water pools are coloured green by copper salts. Credit: Felipe Gomez/Europlanet 2020 RI
The Danakil Depression in Ethiopia is one of the most inhospitable places on Earth. Water at near-boiling temperatures bubbles up from underground, high salt concentrations create multi-coloured structures, and chlorine and sulphur vapour fogs the air. This month, researchers from the Europlanet 2020 Research Infrastructure, carrying out the first investigation into the site’s geology, mineralogy and biology, have found that the Danakil Depression hosts at least three extreme ecosystems that have the potential to help us understand how life might arise on other planets and moons.
“There are very few scientific publications on the site and no biological descriptions, so we are genuinely exploring new ground from a scientific point of view,” said Dr Felipe Gómez Gómez of the Centro de Astrobiologia (INTA-CAB) in Madrid, who led the expedition. “It is an amazing but hostile place – the temperatures were 42 degrees Celsius during the day and 30 degrees at night, and the chlorine vapour burned our airways. Any microorganisms living here will be extremophilic microbes of a major interest to astrobiologists.”
The Danakil Depression is a volcanic area that stretches from the Dallol Volcano to Lake Assal, close to the Ethiopian border with Eritrea. The area is more than 100 metres below sea level and magma flows very close the surface. Rainwater and seawater from the nearby coast are heated by the magma and forced to the surface, carrying many different salts in solution. In some areas, where the upwelling water is 90 degrees Celsius and highly acidic, high concentrations of sulphur create bright yellow chimneys. Elsewhere, pools of water at 40 degrees Celsius are coloured a turquoise green by copper salts. Dry iron-rich salt crusts form flat mushroom-like features. In some places, several different salts are present, creating a riot of colour.
The expedition to the Danakil depression had three aims: to characterise the regional geology, including the geomorphology and geochemical composition; to survey the area for different metabolic environments in which bacterial populations could have become isolated; and to extract DNA from any bacteria found to develop a metabolic model for the system. Over three days from 5-7 April, the team set up equipment in different stations across the site and measured a range of physical and chemical parameters, including pH, temperature, humidity and oxygen concentrations. The team also collected samples of bacteria and tested a new technique for DNA extraction.
The three researchers included Dr Nuria Rodríguez González of INTA-CAB and Dr Barbara Cavalazzi of the University of Bologna. The field trip was funded as part of Europlanet 2020 RI’s joint research activities and was the first in a series of expeditions to prepare the site as a planetary analogue for access by the wider scientific community.
“After mineral and geochemical characterisation, we will know what kind of materials and bacteria are present and be able to identify the most interesting sites for astrobiology purposes. We are now starting the analysis of our samples and are planning a follow-up trip in a few months time,” said Dr Gómez.
Researchers have used ‘network theory’ for the first time to visually depict the movement of dinosaurs around the world during the Mesozoic Era – including a curious exodus from Europe.
The research, published today in the Journal of Biogeography, also reaffirms previous studies that have found that dinosaurs continued to migrate to all parts of the world after the ‘supercontinent’ Pangaea split into land masses that are separated by oceans.
Study lead Dr Alex Dunhill from the School of Earth and Environment at the University of Leeds, said: “We presume that temporary land bridges formed due to changes in sea levels, temporarily reconnecting the continents.”
“Such massive structures – spanning, for example, from Indo-Madagascar to Australia – may be hard to imagine. But over the timescales that we are talking about, which is in the order of tens of millions of years, it is perfectly feasible that plate tectonic activity gave rise to the right conditions for such land bridges to form.”
In the study, the researchers used the Paleobiology Database that contains every documented and accessible dinosaur fossil from around the world. Fossil records for the same dinosaur families from different continents were then cross-mapped for different periods of time, revealing connections that show how they have migrated.
Some regions of the world, such as Europe, have extensive fossil records from a long history of palaeontology digs, while other parts of the world have been largely unexplored. To help account for this disparity in fossil records, which could otherwise skew the findings, the researchers applied a filter to the database records to only count the first time that a dinosaur family connection occurred between two continents.
The findings support the idea that, although continental splitting undoubtedly reduced intercontinental migration of dinosaurs, it did not completely inhibit it.
Surprisingly, the research also showed that all connections between Europe and other continents during the Early Cretaceous period (125-100 million years ago) were out-going. That is, while dinosaur families were leaving Europe, no new families were migrating into Europe.
Dr Dunhill said: “This is a curious result that has no concrete explanation. It might be a real migratory pattern or it may be an artefact of the incomplete and sporadic nature of the dinosaur fossil record.”
While network theory is commonly used in computer science for quantifying internet data, such as friend connections on Facebook, it has only recently been applied to biology research and this is the first study to use it to on dinosaur research.
Study co-author Dr James Sciberras, from the Department of Biology and Biochemistry at the University of Bath, said: “Network theory has been studied in physics for a number of years, however it is finally permeating into other disciplines. This idea that most things can, and should, be considered in the context of the whole system will lead to some exciting new findings in a wide range of fields.”
Reference:
Alexander M. Dunhill et al, Dinosaur biogeographical structure and Mesozoic continental fragmentation: a network-based approach, Journal of Biogeography (2016). DOI: 10.1111/jbi.12766
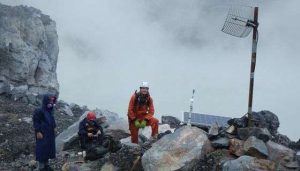
UNM Department of Planetary Sciences Professor Tobias Fischer (in orange) at Poás volcano in Costa Rica.
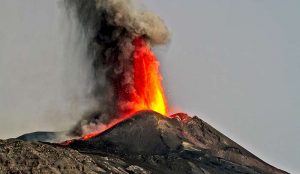
Throughout the centuries, volcanic eruptions have claimed hundreds of thousands of lives due in part to the lack of accurate signs indicating imminent eruptions. One type of a volcanic eruption, a phreatic eruption, which involves external water, is particularly energetic causing a disproportionate number of fatalities. Phreatic eruptions are extremely difficult to forecast, often occurring with little or no geophysical precursors.
Recently, researchers at the Deep Carbon Observatory (DCO), led by Maarten de Moor from the Observatorio Vulcanológico y Sismológico de Costa Rica, Universidad Nacional, Heredia, Costa Rica, (and postdoc at UNM) along with University of New Mexico Professor Tobias Fischer, Department of Planetary Sciences and chair of the Deep Earth Carbon Degassing initiative, measured gas emissions from crater lake at Poás volcano in Costa Rica, in an attempt to determine some of the precursors to major volcanic eruptions.
“The initial goal of the study was to quantify gas fluxes (CO2, SO2, H2S) from Poas volcano and to monitor changes in gas compositions,” said de Moor. “The motivation behind the measurements was firstly to provide robust constraints on gas fluxes as a contribution to global volcanic gas emissions to the atmosphere, and secondly to monitor degassing in order to track volcanic activity for hazard mitigation purposes.”
Excerpt from EPSL paper: “The Poás crater represents one of the most chemically extreme environments on Earth and Poás Volcano National Park was visited by more than 200,000 tourists in 2014. About 60 seismically registered phreatic blasts occurred from the lake during the same year, ranging from minor “gas bursts” to highly explosive jets ejecting ballistics, sediments, vapor and lake water to more than 400 meters above the lake surface. ”
In a new article, published in Earth and Planetary Science Letters recently, the results from a DECADE (Deep Earth Carbon Degassing initiative) project to investigate gas emissions at Poás have delivered promising results.
“Before this study, phreatic eruptions were primarily thought to be generated by changes in hydrothermal systems, and usually occur with no appreciable precursors,” said de Moor. “Our study shows that there are clear short-term changes in gas compositions prior to phreatic eruptions at Poás, and are generated by short-period changes in high temperature volcanic gas input from the deep magmatic system.”
The team measured gas emissions from the crater lake in situ using a fixed multiple gas analyzer station (Multi-GAS) during a two month period of phreatic activity in 2014. The lake was the site of intense phreatic eruptive behavior between 2006 and 2014.
Both accuracy and precision are important in the Multi-GAS measurements. The Multi-GAS instrument measures gas ratios, such as SO2/ CO2 and H2S / SO2. Precision, or the reproducibility, of the Multi-GAS measurements is important when comparing data points within the researchers’ dataset.
“The accuracy, or proximity of the measured value to the true gas ratio, is most important for quantifying gas emission rates from the volcano and for comparing our measured gas compositions to those from other volcanoes or other studies at Poas,” said de Moor. “We did a series of laboratory tests using gas mixtures to estimate both accuracy and precision of the Multi-GAS measurements. These measurements give us confidence that the variations we see in the field data are real.”
“Diagnostic tests prove that the occurrence of eruptions and high SO2/ CO2 are statistically correlated, and that the occurrence of quiescence (no eruptions) and low SO2/ CO2 are also correlated. The results of these diagnostic tests from Poás show scientists that both true predicted values (successful “prediction” of eruption based on high SO2/CO2) and false predicted values (successful “prediction” of quiescence based on low SO2/CO2) are high, indicating strong evidential worth for the association between gas composition and eruptions.”
The gas composition data show significant variations in the ratio between SO2 and CO2, which are statistically correlated with both the occurrence and the size of phreatic eruptions. The scientists found that the composition of gas emitted directly from the lake approaches that of magmatic gas days before large phreatic eruptions.
“The changes in gas chemistry are due to the susceptibility of different gas species to reaction with hydrothermal fluids,” explained de Moor. “CO2 is essentially inert in ultra-acidic conditions and therefore passes through the hydrothermal system and acid lake with minimal modification. In contrast, SO2 is partially removed from the gas phase by hydrothermal reactions producing aqueous bisulfate and liquid/solid native sulfur.”
Excerpt from DCO report: “Gas flux measurements conducted using mini-DOAS (differential optical absorption spectroscopy) show that high emission rates of SO2 from the lake occur during eruptive activity and are also associated with high SO2/CO2.”
“We argued that the efficiency of S removal from the gas is inhibited with increasing gas flux through the hydrothermal system, resulting in increasing SO2/ CO2,” de Moor said. “Importantly, the results suggest that short-period pulses of magmatic gas and heat are directly responsible for generating individual phreatic eruptions.”
Excerpt from DCO report: “These promising results show that high-frequency gas monitoring may provide an effective means of forecasting phreatic eruptions. The biggest challenge to this monitoring approach is maintaining the Multi-GAS instrument in extremely harsh conditions. Peripheral components of the station were destroyed by a large eruption in June 2014, which spelled the end of the lake gas emission experiment. However, the instrument survived and is currently monitoring changes in fumarole gas composition.”
“My main concern is simply trying to keeping these instruments running at active volcanoes, because they are constantly being damaged by toxic gases and eruptions,” said de Moor. “If we can acquire good time-series data, we will learn a lot more about how volcanoes work, why they erupt, and how to predict explosions.
“There are still many things scientists do not know about the interactions between magmatic gases and hydrothermal systems. This study shows in particular that kinetics are very important in these systems. Most geochemical models that are used to understand volcanic degassing assume equilibrium conditions. ”
“Volcanoes are perhaps the most dynamic physical and chemical systems on Earth,” said de Moor. “Once we accept that kinetic factors are often more influential than equilibrium conditions, we will come closer to understanding volcanic degassing processes.”
Reference:
J.M. de Moor et al. Short-period volcanic gas precursors to phreatic eruptions: Insights from Poás Volcano, Costa Rica, Earth and Planetary Science Letters (2016). DOI: 10.1016/j.epsl.2016.02.056