Natural gas hydrates are clathrate hydrates that consist of water molecules and natural gas molecules (major constituent: methane). They are mainly distributed along continental slopes of the oceans or permafrost regions on land. Highly saturated hydrate reservoirs may be ideal alternative energy resources, which makes them an important target area for the exploitation and utilization of natural gas hydrates. Influenced and restricted by the grain size of the sediments, natural gas hydrates are mainly found in the coarse sands, while in fine-grained sediments, the hydrate rarely occurs, or the saturation of the gas hydrates would be relatively low. However, among drilling projects in 2007 in the Shenhu area, South China Sea (SCS), the average sand content in the hydrate reservoir was only around 1.4 to 4.24 percent, and the hydrate saturation was as high as 20 to 40 percent. While related to the supply of gas sources and tectonic activities, this result may also be attributed to the abundant foraminifera shells in the SCS sediments
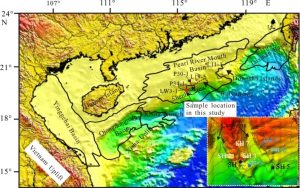
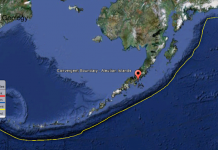
The samples used in this study were obtained from the Shenhu area, SCS, and provided by Guangzhou Marine Geological Survey during voyage HY-2006-3. It was located in E 115°12.52363?N 19°48.40299? where the water depth is 1,554 meters. The seafloor sediments were collected with gravity piston core. Although these samples did not contain natural hydrates, they were obtained near the location where hydrate samples were drilled in 2007 (Figure 1). Because the geological backgrounds between these two kinds of samples were basically the same, the samples analyzed in this study are considered as representative of sediments of the hydrate reservoir.
About 10 g SCS samples were dispersed in water, and the foraminifera shells in the samples were selected and divided into three groups by size (greater than 150μm, 63-150μm, less than 63μm). The abundance of foraminifera in the SCS sediments was relatively high, and almost all the foraminifera were planktonic. In addition, most of the foraminifera is coarse-grained (greater than 150 μm).
Surface and inner structures of the foraminifera shells selected from the SCS sediments were studied by SEM and X-ray CT. The foraminifera shells displayed as a single sphere or multi-chamber structure. The surfaces of the shells showed numerous micropores (six to eight μm), among which some pores were filled with sediments, while most connected the chambers of the shells to the outside space. Most foraminifera shells have effective pore space providing an ideal place for hydrate growth and accumulation. It can also partially explain the high saturation of hydrate in the fine-grained SCS sediments. By statistically analyzing the number of voxels within the grayscale range that represented the inner pores of the foraminifera in the region, the effective volume of pores inside the foraminifera was up to 18.5 percent of the total volume, which indicates that the presence of foraminifera shells increases the porosity of the SCS sediments effectively.
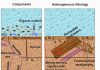
The SCS sediments consisted primarily of silt and sand, and the pores between different grains were tiny and filled with clays. Because of the limited image resolution, only the hydrate distribution in the foraminifera chambers (pores inside the grains) could be observed; in turn, so it was difficult to identify tiny hydrate crystals dispersed between fine grains of the sediments in CT images. The hydrates grew inside the foraminifera. The volume of the hydrates was greater than the corresponding liquid volume. Before the formation of hydrates, only a small amount of water was present inside some foraminifera shells. With hydrates accumulating over time, the liquid and methane gas mitigated toward the inner space of the foraminifera shells via the mouth and the micropores in the shell walls. Except in some of the foraminifera shells filled with other materials, hydrates contacted with the inner walls of the foraminifera shells directly.
Reference:
ChengFeng Li et al, Influence of foraminifera on formation and occurrence characteristics of natural gas hydrates in fine-grained sediments from Shenhu area, South China Sea, Science China Earth Sciences (2016). DOI: 10.1007/s11430-016-5005-3
Note: The above post is reprinted from materials provided by Science China Press.
This video clip shows a few of the lava breakouts active on Kīlauea’s coastal plain on September 20. The activity consisted of scattered pāhoehoe breakouts. The final segment in this video is shown at x20 speed.
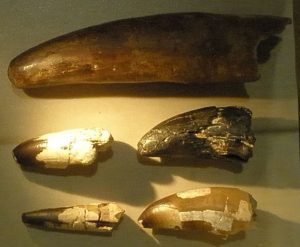
Representative Image, Took the photo at Museo di Storia Naturale di Venezia Credit: Ghedoghedo/Wikipedia
In the dinosaur-rich fossil beds of Morocco, dated to about 100 million years ago, scientists have discovered a strange new crocodile. A fossil was found of an upper and lower jaw preserved together, with oddly shaped teeth. At first, researchers thought it was the snout of a small mammal, but later determined that it belonged to a member of the crocodile-line of evolution. Hardly a monster, this little crocodile-relative would have been less than 2 feet (60 cm) in length.
The new Moroccan fossil sported complex teeth with cusps and basins for crunching through the exoskeletons of insects, much like a small mammal would. Modern crocodiles have relatively simple conical teeth and cannot chew their food, instead swallowing their prey whole or in large chunks. The new crocodile-relative had far more specialized teeth.
In order to study the specimen, the research team of Dr. Jeremy Martin (Centre National de la Recherche Scientifique researcher at Laboratoire de Géologie de Lyon) and Dr. France de Lapparent de Broin (Muséum National d’Histoire Naturelle, Paris) looked at high-resolution CT scans to study the bones’ internal structure without having to destroy any of the fossil. The team also looked at the teeth under very high magnification in order to see the wear pattern and figure out how this odd ‘crocodile’ was using its teeth.
The researchers named the new animal Lavocatchampsa sigogneaurussellae after the French paleontologist René Lavocat (1909-2007) who worked extensively on African fossils, as well as Dr. Denise Sigogneau-Russell and husband Dr. Donald Russell who acquired the fossil. Dr. de Lapparent de Broin says “In the early 1990s, Cretaceous mammals were intensively searched for in Africa; until full preparation eventually revealed single-rooted teeth, it was hard to conceive that the specimen could belong to a crocodile”.
Regarding the new find, lead author Dr. Martin says “The Kem Kem Beds in Morocco have yielded a wealth of extinct creatures, mostly large animals, but with this discovery we realize that part of the ecosystem remains untapped, especially when it comes to small-bodied terrestrial vertebrates”.
Given this animal would have lived alongside giant carnivorous dinosaurs, life could not have been easy for the tiny ‘crocodile’. Not only that, but the waters were teeming with other species of much larger and highly carnivorous crocodile-relatives. Other researchers have suggested close relatives of Lavocatchampsa likely lived on land. Perhaps at the time, it was safer under the feet of dinosaurs than in the water with its larger cousins. Dr. Martins adds “The next step will be to understand their place in this peculiar ecosystem and understand how the ecosystem as a whole was functioning and evolving. Such a discovery opens fascinating perspectives for paleoecological research”.
Reference:
Martin, J. E., and F. de Lapparent de Broin. 2016. A miniature notosuchian with multicuspid teeth from the Cretaceous of Morocco. Journal of Vertebrate Paleontology. DOI: 10.1080/02724634.2016.1211534.
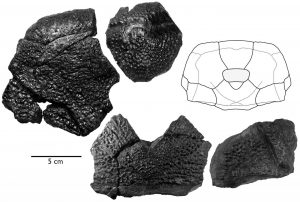
Fossil bones from the skull of Bothriolepis rex and a line drawing of the head viewed from above. The large, thick bones create an armor with a single opening for the eyes. The mouth is on the lower surface of the skull, indicating a bottom-feeding lifestyle. Credit: Valentina Garcia, drawing by Jason Downs.
We’ve all seen “Jurassic Park.” We all know T. rex.
But what about B. rex?
Thanks to a team of scientists from the Academy of Natural Sciences of Drexel University, Delaware Valley University, Stanford University and the University of Chicago, a new rex — Latin for “king” — is in the mix, with the discovery of Bothriolepis rex, a new, giant in the group Antiarchi, which are extinct fish with external, bony armored plates covering their head, shoulders and front fins.
The researchers identified the new fish from fossils first discovered in 2000 near Okse Bay on Ellesmere Island in Nunavut, Canada. The site, within the Nordstrand Point Formation, features 370 million-year-old fossils from the Devonian Period, a time predating most dinosaurs by hundreds of millions of years.
“Bothriolepis rex extends the range of known body sizes for the group Antiarchi,” explained Jason Downs, PhD, a research associate at the Academy and assistant professor at Delaware Valley University. “The large body size and the thick, dense armor present a unique opportunity to address questions about the lifestyle of this unusual group of armored swimmers.”
Downs was the lead author on the paper officially describing the fish, which was co-authored by Ted Daeschler, PhD, vice president of the Academy and a professor in the Department of Biodiversity, Earth and Environmental Science in Drexel’s College of Arts and Sciences. Valentina Garcia, of Stanford, and Neil Shubin, of the University of Chicago, also served as co-authors on the paper published in the Journal of Vertebrate Paleontology.
B. rex’s size eclipses the previous king of the antiarchs, Bothriolepis maxima. B. rex’s body length is estimated at 1.7 meters — roughly five-and-a-half feet long, about 30 percent longer than B. maxima’s estimated length.
The large, thick plates on B. rex’s head were found alongside fossils of other species with thick head plates, suggesting that these were necessary to survive the “stabbing bites of large sarcopterygians,” which were predatory fish from the same time period.
Despite that armor, the evidence doesn’t point to B. rex sharing T. rex’s ferocity.
“Bothriolepis is a group of bottom-dwelling armored aquatic vertebrates,” Downs said. “The flat bottom and the downward-facing mouth suggest feeding on detritus plant or animal material in the mud or sand. It was not equipped for active predation.”
As such, the heavy, compact bones could have also solved buoyancy issues for a fish that spent most of its time on the bottom.
One aspect of the fish immediately challenged the researchers’ assumptions.
“Skull shape changes with body size in Bothriolepis,” Downs said. “Despite the gigantic size of the B. rex, its skull doesn’t reflect our expectations for the size. Instead, the skull shape is suggestive of a smaller Bothriolepis.”
A finding like this could alter the way scientists understand the size-shape relationships in Bothriolepis, according to Downs.
Although popular culture tends to think “bigger is better” when it comes to these prehistoric beasts — which is probably why you’re much more familiar with T. rex than Procompsognathus — it turns out that size may have done B. rex in.
“All antiarchs are extinct by the end of the Devonian Period,” Downs said. “We can’t know exactly why B. rex went extinct, but large-bodied species are often found to be at a higher risk of extinction than small-bodied ones.”
Reference:
Jason P. Downs, Edward B. Daeschler, Valentina E. Garcia & Neil H. Shubin. A new large-bodied species of Bothriolepis (Antiarchi) from the Upper Devonian of Ellesmere Island, Nunavut, Canada. DOI: 10.1080/02724634.2016.1221833
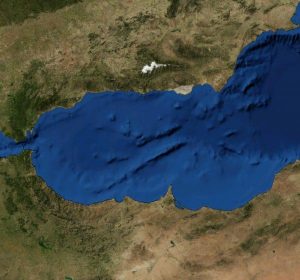
Two sea bed loggings from the Alboran Sea have been analyzed at very high resolution and have allowed to reconstruct climate and oceanographic conditions as well as anthropogenic influence in the westernmost region of the Mediterranean Sea over that period. Credit: UGRdivulga
A multidisciplinary research team in which the University of Granada (UGR) takes part has achieved a breakthrough on what we know about terrestrial and oceanic responses to climate variability over the last millennium, including the industrial period.
Two sea bed loggings retrieved from the Alboran Sea’s basin and analyzed at very high resolution have allowed the reconstruction of climate and oceanographic conditions, as well as the identification of anthropogenic influence in the westernmost region of the Mediterranean Sea over that period.
Global warming, climate change and their effects on health and safety are probably the worst threats in mankind’s history. Recent reports from the Intergovernmental Panel on Climate Change (IPCC 2007, 2014) have furnished scientific evidence such as that the observed rise in mean ground temperature all over the world from the beginning of the 20th century is probably due to anthropogenic influence.
Moreover, global mean concentration of carbon dioxide in the atmosphere has risen since the industrial revolution due to human activities. Said concentration has surpassed that found in ice cores over the last 800 000 years, too. In this regard, in January 2016 the NASA and the United States’ NOAA (National Oceanic and Atmospheric Administration) revealed that global mean temperature in 2015 was the highest one since 1880, when we started to record it.
Reconstructions of the global ground temperature in the Northern Hemisphere over the last millennium show hotter conditions during the so called Medieval Climatic Anomaly (800-1300 A.C.) and cooler temperatures during the Little Ice Age (1300-1850 A.C.).
Natural climate variability
Climate models give us a coherent explanation of the progressive cooling over the last millennium due to a natural climate variability (solar cycle changes and volcanic eruptions). However, we can see that said global tendency has reverted during the 20th century. Climate models are not capable of simulating the fast warming observed during the last century without including human impact along with natural mechanisms of climate forcing.
With this in mind, a multidisciplinary team of researchers from Germany’s Center for Biodiversity and Climate Research (Vanesa Nieto-Moreno), the University of Granada (Miguel Ortega-Huertas), Spain’s CSIC (Francisca Martínez-Ruiz, David Gallego-Torres and Santiago Giralt), the Autonomous University of Barcelona (Jordi García-Orellana and Pere Masqué) and Holland’s Institute for Marine Research (Jaap Sinninghe Damsté) has carried out a research on the reconstruction of climate and oceanographic conditions in the westernmost region of the Mediterranean Sea. For that purpose, they have used marine sediments retrieved from the Alboran Sea’s basin.
The studied region is very interesting, since it’s specially sensitive and vulnerable to anthropogenic and climate forcing due to it being a semi-closed basin located in a latitude affected by several climate types. Several organic and inorganic geochemical indicators have been integrated in the model for this research, thus deducing climate variables such as sea surface temperature, humidity, changes in vegetation cover, changes in sea currents and human impact.
Said indicators have shown consistent climate signals in the two sea bed loggings: essentially hot and dry climate conditions during the Medieval Climatic Anomaly, which switched to mostly cold and wet conditions during the Little Ice Age. The industrial period showed wetter conditions than during the Little Ice Age, and the second half of the 20th century has been characterized by an increasing aridity.
Climate variability in the Mediterranean region seems to be driven by variations in solar irradiation and changes in the North Atlantic Oscillation (NAO) during the last millennium. The NAO alternates a positive phase with a negative one. The positive phase is characterized by western winds, which are more intense and move storms towards northern Europe, which resulted in dry winters in the Mediterranean region and the north of Africa during the Medieval Climatic Anomaly and the second half of the 20th century.
In contrast, the negative phase is associated with opposite conditions during the Little Ice Age and the industrial period. Our records show that, during NAO prolonged negative phases (1450 and 1950 A.C.), there occurred a weakening of the thermohaline circulation and a reduction of “upwelling” events (emergence of colder, more nutrient-rich waters). Anthropogenic influence shows up in the unprecedented increase of temperature, progressive aridification and soil erosion, and an increase of polluting elements since the industrial period. On a broad scale, atmospheric circulation patterns, oceanic circulation patterns (the NAO and the Atlantic meridional overturning circulation), and variations in solar irradiance seem to have played a key role during the last millennium.
Results show that recent climate records in the westernmost region of the Mediterranean Sea are caused by natural forcing and anthropogenic influence. The main conclusions derived from this research have been recently published in a special volume of the Journal of the Geological Society of London about climate change during the Holocene.
Reference:
Palaeoclimate and palaeoceanographic conditions in the westernmost Mediterranean over the last millennium: an integrated organic and inorganic approach. DOI: 10.1144/jgs2013-105
Geology Professor James L. Anderson demonstrates techniques researchers use for collecting samples of molten lava. If you’re interested in studying geology, come earn your undergraduate degree here at the University of Hawaii at Hilo, where geology goes beyond textbooks.
In general, scientists collect samples of molten lava for later analysis in the laboratory, to compare the chemistry from one eruption to the next, which provides clues as to the source of the magma supply below—is it fresh magma from the hot spot, or is it from an existing or evolving magma chamber, or a mixture? Samples of molten lava (2000 degrees F; 1200 C) are quenched in a can of water, and they immediately turn to glass; slower cooling would allow the lava to become rock.
Note the scientists are wearing heavy-duty clothing, gloves, and boots for this operation. Some of the “lava sampling” shown here is more of a demonstration of viscosity of lava, especially the last scene, in which hardened crust is brought up on the rock hammer.
As a consequence of a warming Earth, the risk of a megadrought — one that lasts more than 35 years — in the American Southwest likely will rise from a low chance over the past thousand years to a 20- to 50-percent chance in this century. However, by slashing greenhouse gas emissions, these risks are nearly cut in half, according to a Cornell-led study in Science Advances, Oct. 5.
“Megadroughts are rare events, occurring only once or twice each millennium. In earlier work, we showed that climate change boosts the chances of a megadrought, but in this paper we investigated how cutting fossil fuel emissions reduces this risk,” said lead author Toby Ault, Cornell professor of earth and atmospheric science. If climate change goes unabated — and causes more than a 2-degree Celsius rise in atmospheric temperature — megadroughts will become very probable, Ault said.
“The increase in risk is not due to any particular change in the dynamic circulation of the atmosphere,” Ault said. “It’s because the projected increase in atmospheric demand for moisture from the land surface will shift the soil moisture balance. If this happens, megadroughts will be far more likely for the next millennium.”
Ault explained a natural “tug-of-war” governing the surface moisture balance between the precipitation supply (rain) and evaporation (transpiration). But he cautions that increases in average regional temperatures could be so dramatic — more than 4 degrees Celsius (7.2 degrees Fahrenheit) — that evaporation wins out. This, in turn, dries out the land surface and makes megadroughts 70- to 99-percent likely.
“We found that megadrought risk depends strongly on temperature, which is somewhat good news,” Ault said. “This means that an aggressive strategy for cutting greenhouse gas emissions could keep regional temperature changes from going beyond about 2 degrees Celsius (3.6 degrees Fahrenheit).”
This lower average warming figure cuts the megadrought risk almost in half, he said. These tug-of-war scenarios could very well play out in the American Southwest, according to tree ring and geologic records. During sequences of exceptionally dry years, those rings tend to be relatively narrower than in wet years, he said.
“Tree rings from the American Southwest provides evidence of megadroughts, as there are multiple decades when growth is suppressed by dry conditions,” Ault said, pointing to several megadroughts that occurred in North America between 1300 and 1100 B.C.
“We also know they have occurred in other parts of the world, and they have been linked to the demise of several pre-industrial civilizations,” he said. The tug of war between moisture supply and demand might play out differently in other parts of the world, Ault said.
“Nonetheless, even in the Southwest we found examples of plausible 21st-century climates where precipitation increases, but megadroughts still become more likely,” said Ault, who noted the normally verdant Northeast is in the middle of drought. “This should serve as a cautionary note for areas like the Northeast expecting to see a more-average moisture supply.
“Megadrought risks are still likely to be higher in the future than they were in the past,” he said. “Hence, efficient use of water resources in the drought-stricken American Southwest are likely to help that region thrive during a changing climate.”
“I wouldn’t ever bet against our ability to, under pressure, come up with solutions and ideas for surmounting these challenges,” said co-author Jason Smerdon of Columbia University’s Lamont-Doherty Earth Observatory,” but the sooner we take this seriously and start planning for it, the more options we will have and the fewer serious risks we’ll face.”
Reference:
T. R. Ault, J. S. Mankin, B. I. Cook, J. E. Smerdon. Relative impacts of mitigation, temperature, and precipitation on 21st-century megadrought risk in the American Southwest. Science Advances, 2016; 2 (10): e1600873 DOI: 10.1126/sciadv.1600873
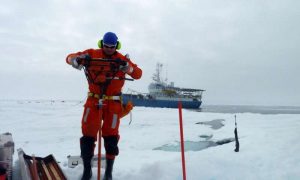
Aleksey Shestov works on the ice during the last leg of the Norwegian Polar Institute’s N-ICE 2015 expedition. Credit: Marcel Nicolaus
Every school child knows that ice melts in the summer and freezes in the winter. But it turns out that the process isn’t that simple in the Arctic, where one type of sea ice structure, called an ice ridge, can actually get stronger in the summer due to melting.
Think of it as Lazarus ice: instead of melting away to nothing in the heat of the Arctic summer, some ice ridges actually come back to life like Lazarus from the Bible, and are stronger at the end of the summer.
Scientists predict that ships will be able to sail directly over the North Pole by 2050. The Northern Sea Route, which extends from the North Atlantic along the northern coast of Arctic Russia to Asia, reduces the shipping distance between Europe and Asia by as much as 40 per cent compared to travel via Suez Canal. While low oil prices have reduced the traffic on this route to just 18 ships in 2015, in 2013 71 ships traveled the route with more than 1.3 million tonnes of cargo.
In spite of the variation in numbers, the trend is clear. Naval engineers need the most comprehensive information they can get to design ships and ocean structures for a future that can include travel through polar seas. And that’s where the research of Aleksey Shestov, a postdoc with the Norwegian University of Science and Technology’s Sustainable Arctic Marine and Coastal Technology Programme, or SAMCoT, comes in.
Icebergs rare, ice ridges common
Shestov studies ice ridges, big wrinkles in sea ice that form when ice floes slam together. What makes ice ridges of particular interest for both ships and offshore structures like oil platforms is that they are far more common than icebergs.
“When you talk about icebergs (the probably of a collision) is a 100-year event,” which means that it has only a 1 percent chance of happening in any one year, Shestov says. In contrast, ice ridges need to be factored into ship and offshore structure designs “because you expect to encounter ice ridges every day.”
Shestov is specifically interested in understanding the complicated freezing processes that take place inside an ice ridge. The way an ice ridge freezes together over time partly controls how big and strong it can get.
Shestov had an unusual opportunity to look at what happens to ice ridges during the summer last year when he spent part of May and much of June aboard the Lance polar research vessel. The Lance spent six months in the Arctic waters north of Svalbard for a multinational research project coordinated by the Norwegian Polar Institute to study young, or first-year sea ice.
Salinity is key
If you could cut an ice ridge in half, what you would see would be the ridge, above water, which researchers call the sail, and a protrusion underwater, which researchers call the keel. The flat sea ice around the ridge itself is called the level ice. The core of the ridge is made up of jumbled blocks of sea ice that smashed together and then were frozen solid.
The blocks of ice that form the centre of the ridge have holes between them, which not surprisingly are filled with sea water. Sea water, being salty, freezes at a lower temperature than fresh water, so it can remain liquid even as it is entombed inside the core of the ice ridge.
During the winter, ice ridges freeze hard and they can grow, as atmospheric cooling causes more and more ice to form around the ridge, Shestov said. As spring comes with its warmer temperatures, ice ridges melt, both from above and from below. But here’s where the surprise comes in.
As the ice ridge melts from the top, puddles of relatively fresh water form around the sail of the ridge, and that melt water can trickle into the core of the ridge, causing the briny sea water that is trapped in between the jumbled blocks inside the ridge to become less salty.
“This dribbling down of fresh water helps consolidate the ridge, because when it replaces the salt water, it can extract the cold from the ice in the ridge and freezes,” Shestov says. “So the ice ridge actually consolidates during the summer. It’s still melting, but there is also freezing inside the ridge.”
That means ice ridges can be stronger than they might seem given their size, because of this interaction between the ice and fresh water.
First-hand experience of thawing
While Shestov has a background as a physicist and mathematician, his affiliation with SAMCoT and his work at UNIS, the University Centre in Svalbard, has led him to spend more and more time out in the field, measuring sea ice ridges and developing physical models of how they grow and thaw.
Sometimes this work takes a surprising turn, as it did during the last few days of the N-ICE cruise last June. At that point, the Lance was anchored to a thin ice floe that was several kilometers across, where Shestov and a number of other scientists were making measurements.
Everyone knew the ice floe would melt. That was part of the reason they had anchored up to the floe, so that they could measure what happened with temperatures and salinities as the ice floe melted away. But when the ice floe finally broke up, it happened extremely quickly.
“Suddenly cracks appeared by the ship. We were right by the ice edge, and exposed to the dynamics of the open sea. A small swell was all it took,” wrote Mats Granskog, chief scientist for the cruise on a blog post for the project. “Within minutes our floe had disintegrated into smaller floes, no bigger than some tens of meters in size.”
Stay calm and keep filming
Shestov watched with fascination as the floe broke up, with much of his equipment still out on the ice, where he had originally planned to continue his work. Once the ice began to break up, however, he knew the ice would break up relatively fast.
“I was surprised that some of my colleagues were actually planning to work again, after we saw part of the floe break up. They thought that all we needed to do was to adjust the mooring line and continue, but when the floe began to break up, it was a clear signal that the swell had arrived and it was time to hurry up.
It took at least two hours to pluck all the scientific equipment off of the ice, which the crew managed to do without losing anything. Shestov made a video of the experience. “I just try to stay calm and do the work that is needed,” he said.
You can see the video he made of the ice breakup at:
Reference:
Thermodynamic consolidation of ice ridge keels in water at varying freezing points. AS Shestov and AV Marchenko. Cold Regions Science and Technology 121:1-10. January 2016
The consolidation of saline ice blocks in water of varying freezing point: Laboratory experiments and computer simulations. AS Shestov and AV Marchenko. Cold Regions Science and Technology 122:71-79. February 2016
At least 27 people are missing after a massive landslide, triggered by heavy rains brought by Typhoon Megi, hit a village in east China’s Zhejiang province. The landslide struck Sucun Village in Suichang County on Wednesday “Sep 28, 2016”, destroying several buildings. Rescuers have tried to contact the village chief and the chief of a nearby township but had not been able to locate them so far.
The Chinese city that boasts the largest number of dinosaur eggs in the world has added a new batch to its impressive collection.
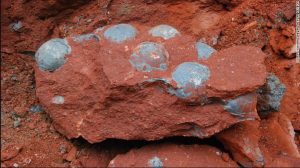
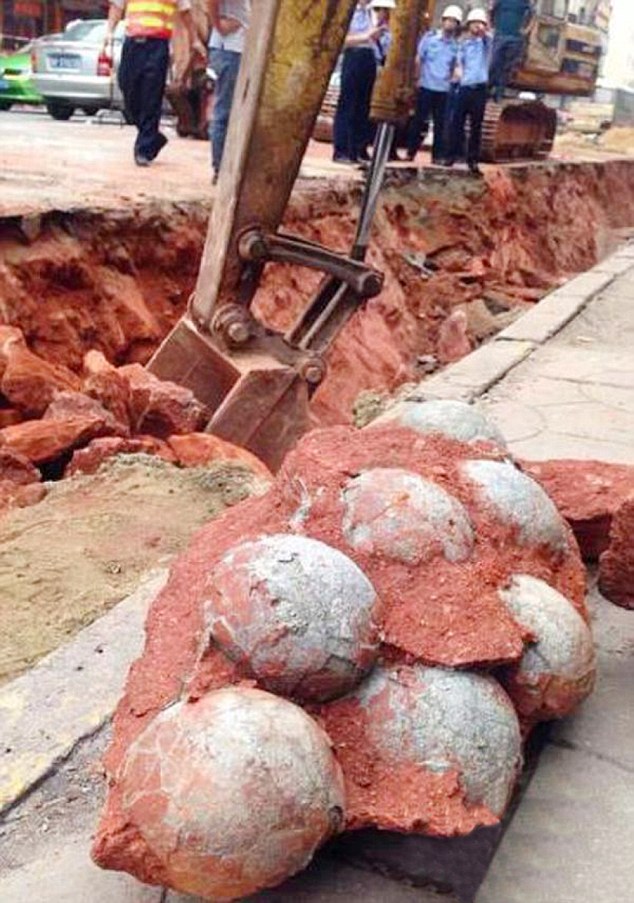
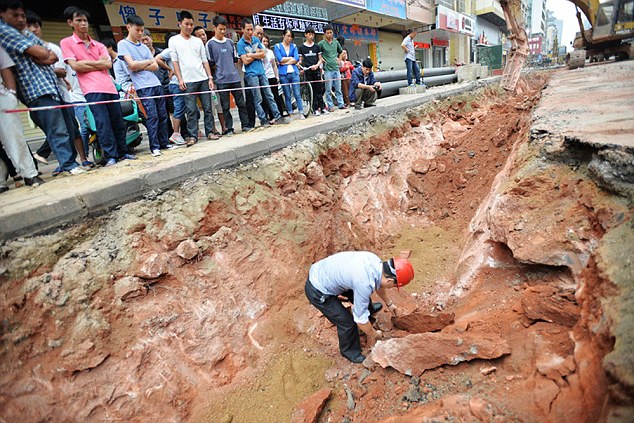
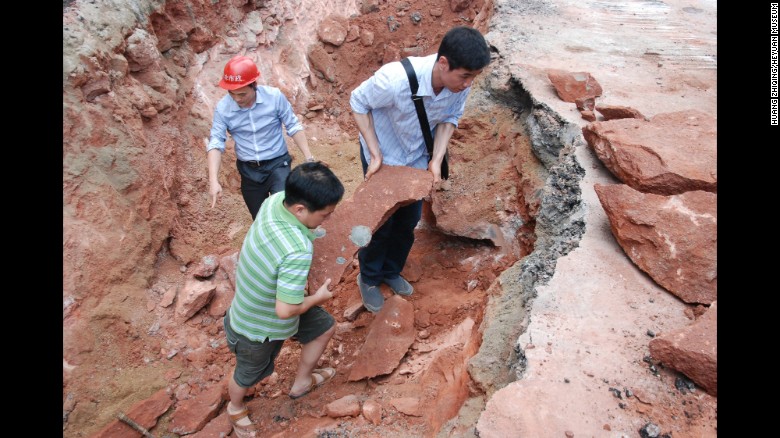
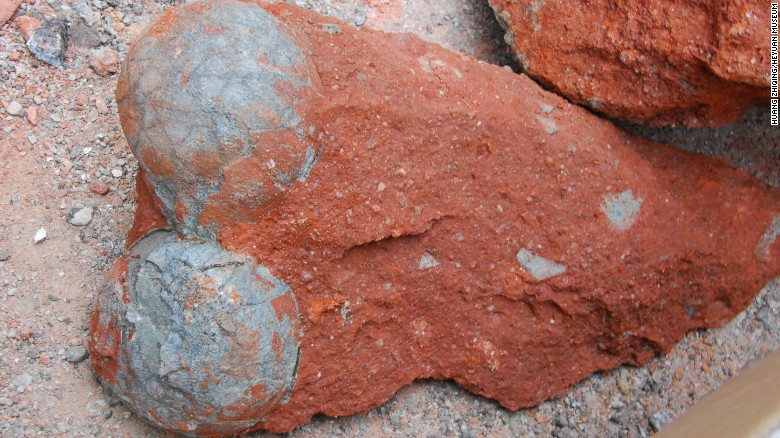
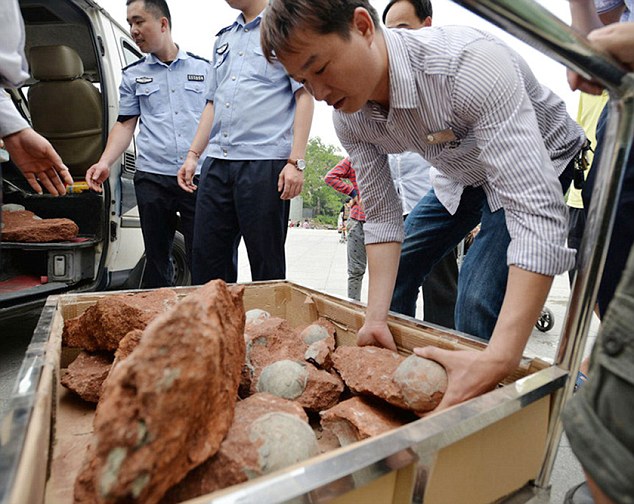
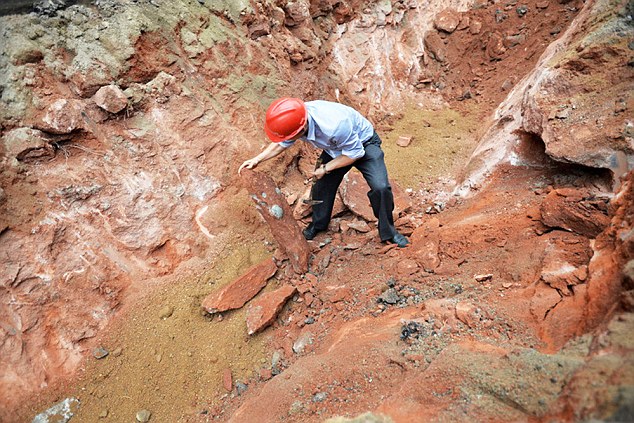
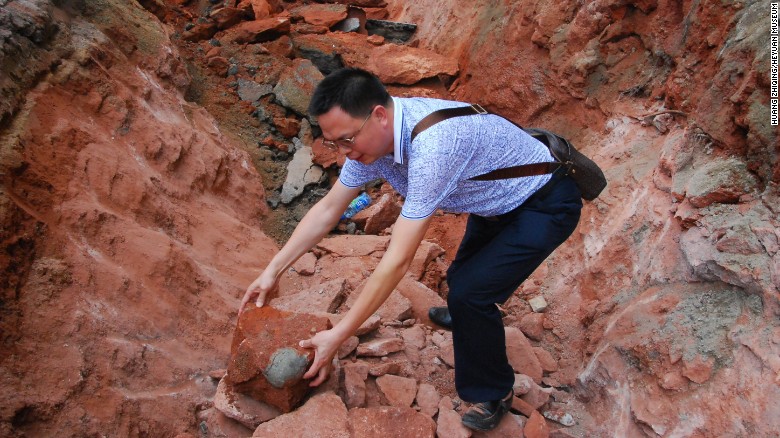
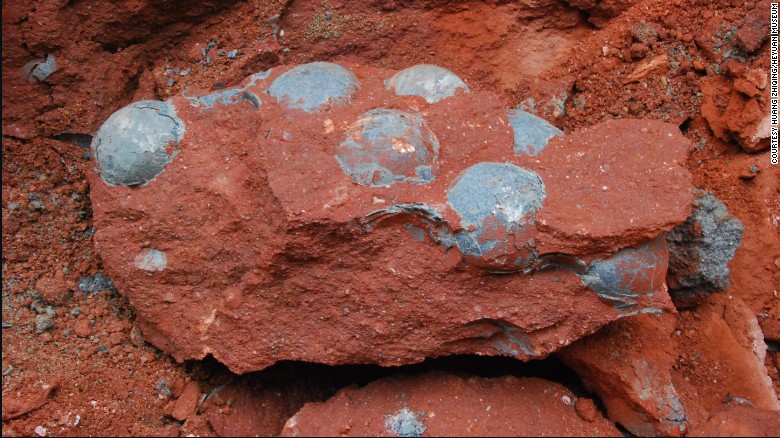
Construction workers unearthed 43 fossilized dinosaur eggs during road repair work in Heyuan city in the southern Chinese province of Guangdong on Sunday, officials said.
The city, which calls itself the “Home of Dinosaurs,” won a Guinness World Record for the world’s largest collection of dinosaur eggs at its museum in 2004.
Huang Zhiqing, deputy director of the Heyuan Museum, told CNN that it was the first time the fossils have been discovered in the bustling city center.
Major road repair work was halted as a team of researchers and construction workers jumped down into a ditch to dig out the fossils.
Eggs as wide as 5 inches
Nineteen of the eggs are completely intact, with the largest measuring as much as 13 centimeters (5 inches) in diameter, Huang said.
Researchers said they will continue to examine the fossils to determine which dinosaur species they belong to.
Most of the eggs in the museum’s existing collection belong to oviraptorid and duck-billed dinosaurs, which roamed the earth 89 million years ago.
Nearly 17,000 dinosaur eggs have been uncovered in the city since the first group of fossils was found in 1996 by children playing at a construction site, the China’s official news agency Xinhua reported.
Unearth nest of FORTY-THREE fossilised dinosaur eggs
1 of 8
Fossilized dinosaur eggs found in China
Note: The above post is reprinted from materials provided by CNN.
An artist’s depiction of an ice-covered planet in a distant solar system resembles what the early Earth might have looked like if a mysterious mix of greenhouse gases had not warmed the climate. Credit: European Southern Observatory (ESO)
For at least a billion years of the distant past, planet Earth should have been frozen over but wasn’t. Scientists thought they knew why, but a new modeling study from the Alternative Earths team of the NASA Astrobiology Institute has fired the lead actor in that long-accepted scenario.
Humans worry about greenhouse gases, but between 1.8 billion and 800 million years ago, microscopic ocean dwellers really needed them. The sun was 10 to 15 percent dimmer than it is today — too weak to warm the planet on its own. Earth required a potent mix of heat-trapping gases to keep the oceans liquid and livable.
For decades, atmospheric scientists cast methane in the leading role. The thinking was that methane, with 34 times the heat-trapping capacity of carbon dioxide, could have reigned supreme for most of the first 3.5 billion years of Earth history, when oxygen was absent initially and little more than a whiff later on. (Nowadays oxygen is one-fifth of the air we breathe, and it destroys methane in a matter of years.)
“A proper accounting of biogeochemical cycles in the oceans reveals that methane has a much more powerful foe than oxygen,” said Stephanie Olson, a graduate student at the University of California, Riverside, a member of the Alternative Earths team and lead author of the new study published September 26 in the Proceedings of the National Academy of Sciences. “You can’t get significant methane out of the ocean once there is sulfate.”
Sulfate wasn’t a factor until oxygen appeared in the atmosphere and triggered oxidative weathering of rocks on land. The breakdown of minerals such as pyrite produces sulfate, which then flows down rivers to the oceans. Less oxygen means less sulfate, but even 1 percent of the modern abundance is sufficient to kill methane, Olson said.
Olson and her Alternative Earths coauthors, Chris Reinhard, an assistant professor of earth and atmospheric sciences at Georgia Tech University, and Timothy Lyons, a distinguished professor of biogeochemistry at UC Riverside, assert that during the billion years they assessed, sulfate in the ocean limited atmospheric methane to only 1 to 10 parts per million — a tiny fraction of the copious 300 parts per million touted by some previous models.
The fatal flaw of those past climate models and their predictions for atmospheric composition, Olson said, is that they ignore what happens in the oceans, where most methane originates as specialized bacteria decompose organic matter.
Seawater sulfate is a problem for methane in two ways: Sulfate destroys methane directly, which limits how much of the gas can escape the oceans and accumulate in the atmosphere. Sulfate also limits the production of methane. Life can extract more energy by reducing sulfate than it can by making methane, so sulfate consumption dominates over methane production in nearly all marine environments.
The numerical model used in this study calculated sulfate reduction, methane production, and a broad array of other biogeochemical cycles in the ocean for the billion years between 1.8 billion and 800 million years ago. This model, which divides the ocean into nearly 15,000 three-dimensional regions and calculates the cycles for each region, is by far the highest resolution model ever applied to the ancient Earth. By comparison, other biogeochemical models divide the entire ocean into a two-dimensional grid of no more than five regions.
“There really aren’t any comparable models,” says Reinhard, who was lead author on a related paper in Proceedings of the National Academy of Sciences that described the fate of oxygen during the same model runs that revealed sulfate’s deadly relationship with methane.
Reinhard notes that oxygen dealt methane an additional blow, based on independent evidence published recently by the Alternative Earths team in the journals Science and Geology. These papers describe geochemical signatures in the rock record that track extremely low oxygen levels in the atmosphere, perhaps much less than 1 percent of modern values, up until about 800 million years ago, when they spiked dramatically.
Less oxygen seems like a good thing for methane, since they are incompatible gases, but with oxygen at such extremely low levels, another problem arises.
“Free oxygen [O2] in the atmosphere is required to form a protective layer of ozone [O3], which can shield methane from photochemical destruction,” Reinhard said. When the researchers ran their model with the lower oxygen estimates, the ozone shield never formed, leaving the modest puffs of methane that escaped the oceans at the mercy of destructive photochemistry.
With methane demoted, scientists face a serious new challenge to determine the greenhouse cocktail that explains our planet’s climate and life story, including a billion years devoid of glaciers, Lyons said. Knowing the right combination other warming agents, such as water vapor, nitrous oxide, and carbon dioxide, will also help us assess habitability of the hundreds of billions of other Earth-like planets estimated to reside in our galaxy.
“If we detect methane on an exoplanet, it is one of our best candidates as a biosignature, and methane dominates many conversations in the search for life on Mars,” Lyons said. “Yet methane almost certainly would not have been detected by an alien civilization looking at our planet a billion years ago — despite the likelihood of its biological production over most of Earth history.”
Reference:
Stephanie L. Olson, Christopher T. Reinhard, Timothy W. Lyons. Limited role for methane in the mid-Proterozoic greenhouse. Proceedings of the National Academy of Sciences, 2016; 201608549 DOI: 10.1073/pnas.1608549113
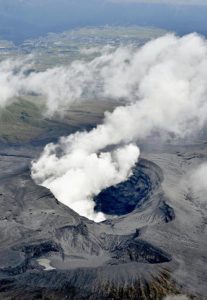
In this aerial view, plumes of white smoke rise from Mount Aso Nakadake Crater in Kumamoto Prefecture, southern Japan, Saturday morning, Oct. 8, 2016 following eruptions earlier in the day. Mount Aso has sent huge plumes of gray smoke as high as 11 kilometers (6.8 miles) into the air in one of the volcano’s biggest explosions in years. Credit: Hiroko Harima/Kyodo News via AP
Mount Aso in southern Japan sent huge plumes of gray smoke as high as 11 kilometers (6.8 miles) into the air on Saturday in one of the volcano’s biggest explosions in years.
The Japan Meteorological Agency said the explosion in the early hours of Saturday also blew off bits of volcanic rock and ash and raised the alert level for the area, extending the entry ban from just around the volcanic mouth to the mountain itself.
Footage on Japan’s NHK public television showed orange flames flickering from several locations on the mountaintop as the volcano emitted thick gray smoke billowing into the sky.
There are no homes within the off-limit area and no injuries or major damage have been reported in nearby towns, though buildings and cars were covered with thick ash falls. Flights were largely unaffected, except for some delays.
A window at a youth center just a few kilometers (miles) away from the mountain suffered a crack apparently from volcanic rocks.
Masaaki Yamamoto, a manager at the center, told NHK that he heard small volcanic rocks hitting the exterior of the building, and found a crack in the window along with chunks of volcanic debris about the size of a golf ball near it.
Aso city, about 10 kilometers (6 miles) north of the volcano, set up evacuation centers as a precaution. Residents were washing off ash from external walls, plants and the streets before it dries up and spreads farther. Media reports said some ash falls were detected in parts of western Japan.
The area is still recovering from deadly earthquakes in April.
Mount Aso has repeated smaller eruptions in recent years. The agency said it was not known if the volano’s recent activity was related to the earthquakes earlier this year, but it’s in an unstable condition and could erupt again.
Japan sits atop the Pacific “ring of fire” and has more than 100 volcanoes.
Mount Aso had a smaller eruption in August while eruptions in 2014 disrupted tourism in the area.
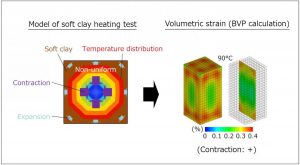
Overall volumetric strain is contractive. Credit: NITech
Unlike other geomaterials, soft clay can paradoxically contract upon heating. This phenomenon is termed the “volumetric contraction of soft clay due to heating.”
The thermodynamic behavior of geomaterials has received the increasing interest over the last two decades in the pursuit of understanding the effect of isotopic heating. Highly radioactive wastes are often buried in containers. Such containers are made from the absorbent clay bentonite mixed with other very stiff clays, as the integrity of which is essential for ensuring that these radioactive materials do not enter the ground, which would lead to a catastrophic environmental disaster. These containers and the surrounding geomaterials are exposed to the heat emitted from the waste materials, and this can continue for tens of thousands of years. This type of heating is impossible to replicate through field tests considering the massive timescale over which the heating occurs, making it imperative that accurate models are developed to predict the likely thermo-hydro-mechanical (THM) behaviors of clays.
Up until now, there has been an apparent incongruence between the observed behavior of clays when heated in the laboratory and the models used to describe this behavior. Heating tests have indicated that heat-induced changes in volume depend on the over-consolidation ratio (OCR) of the soils tested, with soft or consolidated clays tending to contract upon heating. However, the simple model that has been proposed to explain the behavior of soft sedimentary rock assumes that the geomaterial expands upon heating, regardless of its compaction level.
The researchers Feng Zhang and Yuhei Kurimoto at the Nagoya Institute of Technology (NITech) found new insights into the modeling of clays. They conducted a numerical simulation to reveal that a well-organized thermo-elastoplastic model can be used to accurately describe the phenomenon. They further confirmed that heating tests conducted by other investigators were not elementary tests but that they represented a Boundary Value Problem (BVP).Zhang and Kurimoto concluded that it is not necessary to include any additional parameters in the thermo-elastoplastic model to describe the volumetric contraction of soft clay due to heating, according to the universal rule that any materials will expand upon heating. “Because the heating test is a BVP, the phenomenon is simply an average behavior of the BVP and not an inherent property of the soil.” They stated also, “The proper modeling of the thermodynamic behavior of soft soils at elementary level will greatly increase the accuracy of the analysis on geoengineering problems related to thermal influence.”
In the current study, the researchers used a previously developed model to simulate heating tests of soft clay conducted in validated research. The analysis demonstrated that the previously conducted heating test was a BVP because of the existence of a non-uniform heating field. Further investigations at various heating stages illustrated that even with an extremely low heating rate, non-uniform thermal field within the heated sample will likely result in non-uniform stress and strain fields.
The heating process can be divided into the heat transfer and the water pore dissipation stages. As the thermal conductivity is much higher than hydraulic conductivity in soft clay, it results in rapid heat transfer compared to the rate of water pore dissipation. The analysis illustrated that because these processes do not occur consistently throughout the sample, the change in volume is non-uniform, resulting in contraction of the sample in some areas.
Reference:
Feng Zhang, Yuhei Kurimoto. How to model the contractive behavior of soil in a heating test. DOI: 10.1016/j.undsp.2016.05.001
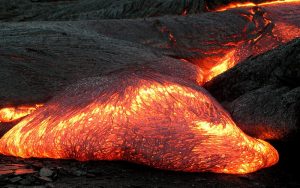
Advancing Pahoehoe toe, Kilauea Hawaii 2003 Credit: Hawaii Volcano Observatory (DAS)
Geologists at Uppsala University have traced magma movement beneath Mt. Cameroon volcano, which will help monitoring for future volcanic eruptions. The results are published in Scientific Reports.
Mt. Cameroon is one of Africa’s largest and most dangerous volcanoes, and its eruptions pose a threat to nearly half a million inhabitants that live on and around its flanks. A team of researchers from Uppsala University set out to unravel the volcano’s underlying magma supply system in order to gather insight into the inner workings of the volcano and to help improve early warning and hazard mitigation strategies.
The researchers revealed a complex magma plumbing system beneath Mt. Cameroon volcano by analyzing crystals from the two most recent eruptions in 1999 and 2000.
‘We were able reconstruct deep-seated magma storage reservoirs at the bottom of the crust, as well as shallow magma pockets in the uppermost crust. These shallow pockets seem to migrate in times of volcanic quiescence and may play a crucial role in priming the volcano for eruption’, says Harri Geiger, PhD student at the Department of Earth Sciences, Uppsala University.
The results further suggest that between eruptions magma batches migrate to shallower depths where they evolve and increase their explosive potential. Hence a longer time between eruptions increases the likelihood of the next eruption being more explosive in style, similar to the Eyjafjallajökull eruption on Iceland in 2010.
‘The problem with volcano monitoring is that it is easy to look for signals, but it is hard to know which signals are meaningful! Our message to the volcano monitoring teams at Mt. Cameroon is that they should focus on the seismic signals of magma migration from about 20 km depth, as such signals are very likely to precede eruptions at Mt. Cameroon’, says Abigail Barker, researcher at the Department of Earth Sciences.
‘The occurrence of shallow magma pockets likely plays a major role in controlling eruptive styles during eruptions and should therefore be routinely considered in hazard mitigation efforts. We believe these results have implications for other related volcanoes in Iceland, Cape Verde, the Canary Islands, and many other locations worldwide’, says Harri Geiger.
Reference:
Harri Geiger et al. Locating the depth of magma supply for volcanic eruptions, insights from Mt. Cameroon, Scientific Reports (2016). DOI: 10.1038/srep33629
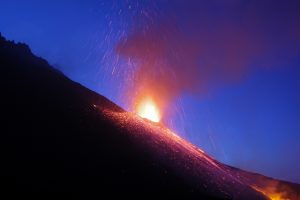
Mount Etna, Italy, erupts at night. Credit: Alessandro Aiuppa, University of Palermo, Italy.
On average, 40 volcanoes on land erupt into the atmosphere each month, while scores of others on the seafloor erupt into the ocean. A new time-lapse animation uniting volcanoes, earthquakes, and gaseous emissions reveals unforgettably the large, rigid plates that make the outermost shell of Earth and suggests the immense heat and energy beneath them seeking to escape.
With one click, visitors can see the last 50 years of “Eruptions, Earthquakes, and Emissions.” Called E3, the app allows the viewer to select and learn about individual eruptions, emissions, and earthquakes as well as their collective impact. Visualizing these huge global datasets together for the first time, users can speed or slow or stop the passage of time. They can observe flat maps or globes, and watch gas clouds circle the planet. Data from Smithsonian’s Global Volcanism Program and the United States Geological Earthquake Survey (USGS) feed into the app, and the datasets are available for free download. The app will update continuously, accumulating new events and additional historical information as it becomes available.
“Have you had a ‘eureka!’ moment where you suddenly see order in what appeared chaotic? This app abounds in such moments,” said Elizabeth Cottrell, head of the Global Volcanism Program of the Smithsonian Institution in Washington, DC. “As geologic events accumulate over time, Earth’s tectonic plates appear before your eyes. What took geologists more than 200 years to learn, a viewer learns in seconds. We wanted to share the excitement with as big an audience as possible. This is the first time we’re able to present these datasets together for the public.”
She added, “This app is interesting not only for educators and the public, but also will help scientists understand global eruption patterns and linkages between Earth’s inner workings and the air we breathe.”
A team of experts developed the app with support from the Smithsonian Institution and the Deep Carbon Observatory, an international multidisciplinary research program exploring the quantities, movements, forms, and origins of carbon deep inside Earth. Deep Carbon Observatory scientists are studying volcanic emissions as part of this mission, and will more than triple the number of permanent volcano gas monitoring stations from 2012-2019.
Tracking volcanic emissions to avoid disaster
Hundreds of millions of people around the world live on the flanks of active volcanoes, and eruptions can cause massive economic damage even when few people live nearby. In 2010, Eyafjallajökull erupted in Iceland, spewing massive ash clouds, disrupting air travel for millions of people and costing the airline industry nearly USD 2 billion. Better anticipation of eruptions could lower the human and economic toll of these natural phenomena.
Recent discoveries by Deep Carbon Observatory (DCO) scientists in the Deep Earth Carbon Degassing (DECADE) initiative are laying the foundation for improved volcanic eruption forecasts. These hard-won advances required expensive, dangerous expeditions to sniff gas emissions for clues.
“We are deploying automated monitoring stations at volcanoes around the world to measure the gases they emit,” said Tobias Fischer, a volcanologist at the University of New Mexico, USA, and leader of DECADE. “We measure carbon dioxide, sulfur dioxide, and water vapor (steam), the major gases emitted by all volcanoes on the planet. In the hours before an eruption, we see consistent changes in the amount of carbon dioxide emitted relative to sulfur dioxide. Keeping an eye on the ratios globally via satellites and on-site monitoring helps us learn the precursors of volcanic eruptions. Monitoring these volcanic gas variations also helps us come up with a more accurate estimate of total volcanic carbon dioxide emissions on Earth — a major goal of DCO.”
“Our goal of tripling the number of volcanoes monitored around the world by 2019 is no small task,” added Fischer. “Installing instruments on top of volcanoes is dangerous work in extremely hard-to-reach places.”
“Sometimes our monitoring stations become victims of eruptions they are trying to measure, as happened recently on Villarrica volcano in Chile. At least our instruments recorded gas composition changes right up until the eruption destroyed them,” Fischer noted.
By 2019, DECADE scientists hope to have gas monitoring stations on 15 of the world’s 150 most active volcanoes. This will add to the eight stations currently operated by other entities such as the USGS and the University of Palermo (Italy). Data collected at these monitoring stations are feeding a new database of volcanic carbon emissions, making potentially life-saving information available to many more scientists around the world.
Advancing knowledge and forecasting potential from land
DCO volcanologists are also advancing basic knowledge about how different volcanoes work, which is further advancing eruption forecasting.
Maarten de Moor and his team at the National University in Costa Rica, for example, using DECADE monitoring stations, have measured gas emissions at Póas and Turrialba volcanoes in Costa Rica over several years. De Moor and colleagues have observed remarkable changes in gas compositions before eruptions at these volcanoes, both of which have a huge impact on local society. Turrialba, for example, deposited ash on the capital city of San José over the last few weeks, affecting about 3 million people and closing the international airport.
“We’re getting more and more confident that changes in the carbon to sulfur ratio precede eruptions,” said de Moor. “Potentially, we can now see an eruption coming just by looking at gas emissions. What is truly fascinating is how dynamic these volcanoes are in their degassing and eruptive behavior. To understand the big picture of Earth degassing, we also need to understand the processes driving temporal variations in volcanic emissions.”
Historically, volcanologists have measured emissions of smelly sulfur dioxide much more easily than colorless, odorless carbon dioxide emissions. But DCO scientists at Centre National de la Recherche Scientifique (CNRS) and Université de Lorraine in France are designing new geochemical tools to detect and monitor large-scale emissions of volcanic carbon dioxide. Tools include a new high-precision method for measuring excess airborne amounts of a rare form of helium found in magma, high-temperature fluids from below Earth’s crust that come out of volcanoes in the form of lava and gases.
“Our helium data suggest that even when they are not erupting, volcanoes constantly release carbon dioxide and other gases through the crust, from magma chambers deep underground,” said Bernard Marty, leader of the CNRS group. “We see low level release of carbon dioxide over large areas surrounding Mt. Etna volcano in Sicily and Erta Ale volcano in Afar, Ethiopia, which tells us this might be happening at sites around the world.”
Eyes in space add to the toolkit
To assess volcanic activity and gas release on a global scale, DCO researchers at the University of Cambridge, UK, are taking yet another approach; measuring volcanic gases from space using satellites.
“While water vapor and carbon dioxide are much more abundant volcanic gases, sulfur dioxide is easier to measure because Earth’s atmosphere contains very little sulfur dioxide,” said Marie Edmonds, co-Chair of DCO’s Reservoirs and Fluxes Science Community. “With satellites, we have been able to measure sulfur dioxide emissions for years and the technology keeps getting better. An exciting new aspect of DCO’s research combines the satellite data with ground-based measurements of carbon to sulfur ratios provided by DECADE. This powerful combination allows us to better define global volcanic emissions, or degassing, of carbon dioxide.”
“DECADE’s volcano-based instruments make it possible for us to ground-truth our satellite observations and obtain much more frequent measurements” added Edmonds. “Eventually we hope we’ll get as accurate measurements from space as we do from the ground. When this happens, we can monitor volcanoes in remote parts of the world for a fraction of the cost and without risking scientists’ lives.” As the data accumulate, they too will stream into and through the E3 app.
Reference:
J. Maarten de Moor, A. Aiuppa, G. Avard, H. Wehrmann, N. Dunbar, C. Muller, G. Tamburello, G. Giudice, M. Liuzzo, R. Moretti, V. Conde, B. Galle. Turmoil at Turrialba Volcano (Costa Rica): Degassing and eruptive processes inferred from high-frequency gas monitoring. Journal of Geophysical Research: Solid Earth, 2016; 121 (8): 5761 DOI: 10.1002/2016JB013150
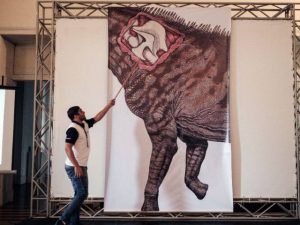
A staff member shows the location of the fossil collected in 1953 by the Brazilian paleontologist Llewellyn Ivor Price on its real scale restoration image. Credit: AFP
Brazil just found its biggest ever dinosaur—in a storage cupboard.
In its prime, more than 66 million years ago, this long necked herbivore was 25 meters (82 feet) long—longer than an articulated bus—and could chomp through trees at a terrifying rate.
By the time the creature was found by renowned Brazilian paleontologist Llewellyn Ivor Price in 1953, only a few hefty, fossilized bits of the spine remained.
Researchers knew immediately they’d stumbled on something big.
They didn’t have the staff or resources to figure out how big, however, so the dinosaur pieces languished the next six decades in storage at Rio’s ornate Museum of Earth Sciences.
Until now
The remains of what has been named “Austroposeidon magnificus”, and pronounced Brazil’s biggest dinosaur, went on general public view for the first time Thursday.
A nearly complete spinal vertebra—about the size of a microwave oven and entirely petrified—and numerous fragments of other vertebrae lie on a black cloth in an upper room of the museum.
Nearby hangs an enormous artist’s rendition, done to scale, of what “Austroposeidon magnificus” might have looked like: a small head, long neck, enormous body and long tail. A patch of the reptile’s skin is shown pulled back to reveal where the prize vertebra would have slotted in.
‘What, 60 years?’
Museum director Diogenes de Almeida Campos said six decades does sound on the slow side for studying such a big find.
“A friend said to me just yesterday, ‘Diogones, what, it took you 60 years?’,” he recalled with a wry smile. “It sounds a bit ridiculous to say this.”
But he explained that in the 1950s Price and his assistants were pioneers in the field for Brazil, and while “it was certain that vertebrae of this size came from a gigantic animal, it needed to be studied.”
Campos said money was an issue holding back research, as well as a lack of people up to the task. Even today there are only 10 serious dinosaur experts in the country, he said.
“We were waiting for the staff…, for a laboratory that started from nothing to mature,” he said. “We made a first effort with students about eight years ago and it didn’t succeed.”
Finally, Campos’ student Kamila Bandeira made the mysterious monster the subject of her doctoral thesis and over the last four years put the pieces of the puzzle together.
Dinosaurs in back yards
The most spectacular dinosaur discoveries come in desert or largely bare areas, such as the US southwest, the south of Argentina or Mongolia, where they are easier to find. The fossilized bones of the biggest dinosaur known to date—an estimated 40 meters (130 feet) long—were unearthed in Argentina in 2014.
“Austroposeidon magnificus” was found, like many other dinosaur remains, by chance during road building near Sao Paulo. The reason only a few fossilized bones were found—and not the whole skeleton—points to the creature’s unceremonious end, Campos says.
“When these animals die, it’s… a huge new source of meat. So all the hunters, the carnivores ate this creature. The first thing they ate is the head, because the brain must be tasty,” said Campos.
“They also broke the long bones to get at the marrow… After, came smaller animals and nothing was left over. Anything that did remain the beetles and the spiders and the ants finished, and when there was just bones, the bacteria came. Finally the remains sank into the lagoon.”
There may be many such discoveries waiting to be made in Brazil’s thick flora.
“Pay attention when roads are built, when wells are dug,” Campos advised. “You could have a dinosaur in your backyard and not realize!”
Extinction then and now
A lifetime hanging around fossils of extinct giants has given Campos, 73, unique perspective on creation and destruction. But today’s world, where human activity dominates for the first time, disturbs him.
“Extinction is as normal a thing for paleontologists, as is the appearance of a new species,” he said. “But in comparison with what’s happening today—the disappearance of tigers or whales—this is not caused by nature.”
“It’s worrying.”
In the palatial but at times shockingly decrepit Rio museum—a victim, like many other Brazilian public institutions, of underfunding—Campos said his job was a great passion.
He recalled studying under the great Price and “traveling with him over almost all of Brazil, collecting materials.”
Tears sprang to his eyes as he pointed out that he, Price and Bandiera were all now linked in a kind of paleontologists’ family tree.
Dinosaur hunting, he said, his voice brimming with emotion, “is an activity you can compare to art.”
Note: The above post is reprinted from materials provided by AFP.
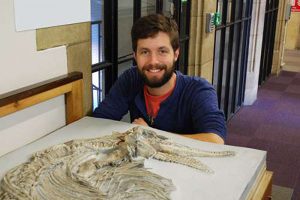
Jonathan Hanson with the ichthyosaur skeleton at the School of Earth Sciences. Credit: University of Bristol
A new species of British ichthyosaur has been identified using skeletal remains that have been on display at the University of Bristol’s School of Earth Sciences for many years.
Ichthyosaurs lived during the age of the dinosaurs but were ocean dwelling reptiles that resembled dolphins or sharks.
They were fierce predators, some growing up to 15 metres long.
The newly identified species lived around 200 million years ago in the early Jurassic period, a time when the UK was a small series of islands.
The six year study, led by the University of Manchester, and published today in Papers in Palaeontology, set out to search for British examples of ichthyosaurs and researchers were able to identify features in the skull and fins of fossilised remains that distinguished the new species from others.
The research was carried out by Dean Lomax (Honorary Scientist at The University of Manchester) and Professor Judy Massare (Brockport College, New York).
Specimen ‘25300’ (the complete skeletal remains of the large ichthyosaurus found in Walton, Somerset) was donated to the University of Bristol around 80 years ago by the City Museum.
It was originally part of the Chaning Pearce collection purchased by the museum in 1915 and donated to the university in 1930.
Joseph Chaning Pearce (1811-1847) was born and lived in Bradford-on-Avon in Wiltshire and during his life built up one of the largest collections of fossils in the country in the early 19th century.
Dean Lomax, Honorary Scientist at the University of Manchester, said: “It’s quite amazing – hundreds of people must walk past this skeleton every day, yet its secrets have only just been uncovered.
“We’ve named the species Ichthyosaurus larkini in honour of the British palaeontologist Nigel Larkin – the name Larkin actually means ‘fierce’ so it’s quite fitting for a fast-moving predator.”
Jonathan Hanson, Collections and Practical Manager from the School of Earth Sciences at the University of Bristol, said: “Ichthyosaurs, with their similarities to both modern fish and dolphins, are among the more arresting and captivating fossil specimens known; we are very lucky to have two such specimens on display in the Wills Memorial Building, as part of the University of Bristol School of Earth Sciences Collection.
“There is no greater honour for a fossil than to be named as a type specimen for a species, and we are very happy to meaningfully contribute to the understanding of the history of life on Earth by supporting the discovery of Ichthyosaurus larkini.”
Reference:
Lomax, D. R. and Massare, J. A. 2016. Two new species of Ichthyosaurus from the lowermost Jurassic (Hettangian) of Somerset, England. Papers in Palaeontology, DOI: 10.1002/spp2.1065
The work revealed that holosteans (blue) and teleosts (red and orange) all possessed diverse shapes and sizes in the past. Credit: University of Pennsylvania
Take a glance around the oceans, rivers and lakes of today and you’ll confront an astonishing diversity of fish, from narrow-bodied eels to the 25-foot-long giant oarfish to delicate, fluttering seahorses. The vast majority of fish alive today — approximately 96 percent — are known as teleosts, a group of ray-finned fish that emerged 260 million years ago.
Evolutionary biologists and paleontologists since Darwin have offered hypotheses to explain why teleosts seem to have “out-evolved” other groups. The closely related holosteans, for example, once dominated the oceans but are now considered “living fossils,” representing just eight species in forms that resemble those of the past.
But this view of the teleost success story may be based on the false premise that teleosts dominate today because they have always been more evolutionarily innovative than other groups. A new analysis of more than a thousand fossil fishes from nearly 500 species led by the University of Pennsylvania’s John Clarke revealed that the teleosts’ success story is not as straightforward as once believed. Examining the first 160 million years of teleost and holostean evolution, from the Permian to the early Cretaceous periods, the scientists show that holosteans were as evolutionarily innovative as teleosts, and perhaps even more so.
“A lot of these so-called living fossils that appear to be kind of boring today actually have a pretty rich history,” said Clarke. “If we were to go back in time to the Triassic and you had to place a bet on which group was going to do better going forward, you would have definitely chosen the holosteans. It just didn’t work out that way.”
Clarke collaborated with Graeme T. Lloyd of Macquarie University and Matt Friedman of the University of Oxford on the work, which appears in Proceedings of the Academy of Natural Sciences.
It’s easy to see why scientists have long presumed teleosts exceptional. They represent 29,000 diverse species worldwide, roughly half of modern vertebrates. In contrast, the eight living species that comprise holosteans share a resemblance, and all dwell in the freshwaters of eastern North America. Numerous ideas have been put forward to explain teleost success, including the flexible structure of their jaws, a diversity of reproductive strategies and the symmetry of their tail fins.
With the emergence of molecular and genetic techniques to probe evolution, researchers have also attributed teleost success to a genome duplication event in the evolutionary past that left the fish with twice the number of chromosomes and thus more raw material with which to acquire beneficial mutations and to evolve.
Yet Clarke and colleagues wanted to back up a bit, questioning the very assumption that teleosts had always been more evolutionarily innovative and successful.
“There were times in the past when holosteans were top dog,” Clarke said. “There are lots of holostean fossils, and they were quite diverse, not only in numbers but in the wide variety of sizes and shapes they possessed.”
It was known from the fossil record that holosteans appeared to be more dominant in the Triassic Period on into the Early and Middle Jurassic. In the Late Jurassic, however, teleosts began to take over.
The researchers decided, therefore, to focus on the earlier period of fish evolution, starting in the Permian, which just preceded the Triassic period, and following it through 160 million years into the Early Cretaceous, which followed the Jurassic.
To do so, they relied on a dataset that included the size and shape of hundreds of fossils Clarke had compiled during visits to 15 museums as part of his Ph.D. research. They also constructed “supertrees,” to summarize the relationships of nearly all known extinct species of holosteans and teleosts from the Triassic, Jurassic and Early Cretaceous. These large trees were built from more than 100 smaller trees already available in the paleontology literature, from studies that examined the morphological traits of fishes to work out their evolutionary tree.
While other researchers have examined patterns of diversity in fish fossils, no one had ever applied a quantitative framework to determine whether holostean or teleost fishes possessed higher rates, or greater innovation, in shape and size.
The Penn-led scientists were able to use the supertrees to evaluate first the rate of size evolution in teleosts versus holosteans and then to compare the degree of shape innovation in the two groups.
In their various analyses of the specimens, Clarke and colleagues found no support for the expectation that teleosts would change their body sizes and shapes faster, or be better able to “invent” new sizes and shapes compared with holosteans. On the contrary, using timescales from molecular studies that suggested holosteans and teleosts evolved much earlier in Earth’s history than when their first fossils appear, holosteans seemed to come out on top, appearing more innovative at evolving new sizes and faster at evolving between different shapes.
“There is no compelling evidence on any timescale that teleosts were the best at evolving different body sizes and shapes,” said Clarke. “And in fact, if anything, there is some evidence hinting that maybe holosteans were more innovative when it came to evolving different body sizes and faster at changing shape.”
The researchers also used the dataset to investigate whether genome duplication correlated with an increase in evolution rate and innovation. They found no consistent link with size evolution but did see indications that shape evolution was elevated in the more geologically recent teleosts with duplicate genomes relative to more ancient groups of teleosts. However, this occurred because those more ancient teleosts were particularly slow at evolving shapes since they compare equally poorly with holosteans, rather than signifying any exceptional evolution in those teleosts with duplicate genomes. On this basis, the authors deem the role of genome duplication on size and shape evolution to be “ambiguous,” suggesting that, in agreement with recent studies of diversification in living teleosts, genome duplication is not the magic bullet that explains the diversity of all teleosts.
Clarke would like to continue delving into the history of neopterygian fishes, particularly those living fossils that are often neglected in favor of researching the more dynamic and diverse living teleosts.
“Many biologists have focused upon trying to explain why some groups are so incredibly successful,” he said. “But there hasn’t been a lot of focus on the other end of the spectrum: how do you get living fossils, these species-poor, long-lived groups that stick around doing the same thing for millions of years.”
Reference:
John T. Clarke, Graeme T. Lloyd, Matt Friedman. Little evidence for enhanced phenotypic evolution in early teleosts relative to their living fossil sister group. Proceedings of the National Academy of Sciences, 2016; 201607237 DOI: 10.1073/pnas.1607237113
New study suggests the frequency of landslides in storm-affected areas will not increase as a result of climate change
The frequency of common landslides is not likely to increase as a result of more rainstorms brought about by future climate change, new research from Cardiff University has shown.
Experts at the School of Earth and Ocean Sciences have shown that while the frequency of rainstorms may increase by up to 10% according to climate change projections, this would produce a long-term increase in shallow landslide frequency of less than 0.5%.
Shallow landslides are the most common type of landslide and are often caused by heavy rainfall. They occur through the collapse of soil, resulting in fast moving debris flows of rock and mud that present a very dangerous hazard to anything in their path.
The new findings, which have been published in the journal Scientific Reports, challenges current theories within the field which suggest that landslide activity could increase proportionally with increased rainfall.
Instead, the research findings show that the triggering of landslides is much more dependent on the build-up of soil – otherwise known as colluvium – on steep hillslopes, as opposed to rainfall from storms.
The research team arrived at their results by performing field investigations in the Southern Appalachian Mountains, specifically looking at how the time taken for soil to accumulate on hillslopes affected the landslide triggering rate. The team then used computer models to calculate how future landslide hazards may develop as a result of climate change.
According to the researchers, shallow landslides occur when soil slowly accumulates on a mountainside over a very long time period, from thousands to tens of thousands of years. During a storm, converging ground water flow and the infiltration of rain into the colluvium causes landslides to be triggered.
It then takes thousands of years for soil to accumulate once again on the mountainside before a landslide can occur again, so an increase in the frequency of storms during this time would have little effect on the frequency of landslides.
Lead author of the study Dr Rob Parker, from Cardiff University’s School of Earth and Ocean Sciences, said: “Our results have shown that lots more storms result in very few extra landslides. Though observations tell us that heavy rainfall triggers landslides, it is the process of soil accumulation that happens in the thousands of years leading up to a landslide that can be really important in determining how often landslides occur.
“Though we still expect shallow landslides to continue to be a major hazard in our future wetter climate, we do not expect the frequency of landslides to increase in proportion to the frequency of extreme precipitation events.”
“Landslides pose a major hazard to life and infrastructure, affecting around 12% of the world’s population who live in mountain ranges,” Dr Parker continued.
“In addition to the direct hazard they pose, landslides are the primary source of sediment in mountain ranges, with significant knock-on effects on river, floodplain and estuarine systems, as well as playing an important role in global biogeochemical cycles.
“The consequences of landslides are therefore wide-reaching, so it’s vital that we get a better understanding of how they may evolve under future climate conditions.”
Reference:
Robert N. Parker et al. Colluvium supply in humid regions limits the frequency of storm-triggered landslides, Scientific Reports (2016). DOI: 10.1038/srep34438