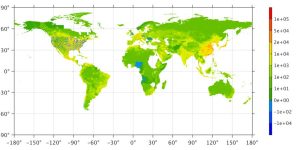
Credit: Daniel Moran, NTNU
A new model creates global hot spot maps to illuminate how what we buy pollutes the planet and where. The idea is to help governments, industries and individuals target areas for cleanup.
Global trade has changed the way the goods we buy are made: in the 1970s, a majority of goods were purchased in the same country where they were produced. Today, cheap shipping and global outsourcing mean that more and more of what Western consumers buy is produced far away.
Environmental footprints already include global supply chains when they show us the impacts of a purchase. But what if in addition to showing you how many kilos of CO2 or other pollutants your purchase causes, the footprint came with a map showing where that purchase is driving environmental impacts?
Two recent articles from researchers at the Norwegian University of Science and Technology (NTNU), Shinshu University in Japan and Yale University in the US try to do precisely that. The researchers show how the environmental footprint of the goods we purchase can be mapped out to find places where that footprint actually falls.
The articles map out “hot spots” for greenhouse gases and unhealthy air, and connect these hot spots to consumers in many countries.
“What we are trying to do is to connect economic activity and global supply chains with environmental impacts. That has not been done before,” said Daniel Moran, a postdoctoral researcher at NTNU’s Industrial Ecology Programme, who was one of the lead authors. “We tried to spatially locate environmental impacts on the production side and link that to global supply chains” on the consumer side.
Finding the where and the what
Solving environmental problems like climate change or air pollution is extremely difficult because they result from many small actions.
Think of your mobile phone. You as a consumer buy one. A company (almost certainly in Asia) makes it. Companies across the globe supply materials to those phone manufacturers so they can assemble them into a mobile phone. All of these individual actions have environmental impacts in all those different countries.
Governments and regulators can pass laws to control pollution from the phone manufacturer, but if you really want to clean up the impact of your phone, you’d have to figure out exactly what and where in the world all those other impacts actually are.
Putting the pieces together
Environmental economists try to calculate the environmental impacts from making products by using tools called life-cycle assessments or “multi-regional input-output” models, abbreviated MRIO.
Simply stated, MRIO models allow researchers to look at one item — your mobile phone — and calculate the environmental impacts caused by producing all its component parts, called the supply chain.
They can also use a different model to calculate the carbon or environmental “footprint” of different activities, which shows by country or region where these environmental impacts are generated.
The next step — combining the two and refining the resolution, to figure out where those environmental impacts actually occur, and linking those impacts to the consumers who actually bought the product — hasn’t been so easy.
Mapping actual locations
Now, Moran and his colleagues have developed a way to put all of the pieces together by combining maps of observed environmental impacts with an economic MRIO model. That means “a company, individual, or government can find the actual locations where their supply chain emissions occur, thus creating new opportunities to participate in reducing the emissions at that place,” the researchers wrote in their paper on mapping carbon footprint hot spots.
The same approach also allowed them to locate hotspots for air pollution more generally and species threats.
Connecting environmental problems to economic activity
Moran says making this connection offers an important opportunity for governments, companies, and individuals to look at their effects on the environment — and find ways to counteract those effects.
“Connecting observations of environmental problems to economic activity, that is the innovation here,” he said. “Once you connect the environmental impact to a supply chain, then many people along the supply chain, not only producers, can participate in cleaning up that supply chain.”
As an example, he said, government regulators can only control the producers whose products cause environmental problems in Indonesia. But if the EU wanted to look at its role in causing those problems in Indonesia, they could look at the maps produced by the researchers and see what kind of impacts EU consumers are having on that country, and where they are falling.
The EU “could decide to adjust their research programmes or environmental priorities to focus on certain hot spots Southeast Asia,” Moran said. “Companies could also use these maps to find out where their environmental impact hot spots are, and make changes.”
Reference:
Daniel Moran, Keiichiro Kanemoto. Tracing global supply chains to air pollution hotspots. Environmental Research Letters, 2016; 11 (9): 094017 DOI: 10.1088/1748-9326/11/9/094017
Note: The above post is reprinted from materials provided by The Norwegian University of Science and Technology (NTNU).


