Back when he was working on his Ph.D. in geophysics at the University of Chicago in the 1980s, Dork Sahagian took a break one day from studying lava flows to attend a lecture on how raindrops form in clouds.
What he learned gave him a fresh perspective on lava and inspired him to develop a new method of estimating the historic elevation of the Earth’s land surfaces.
“At the lecture,” says Sahagian, who is now a professor of earth and environmental sciences at Lehigh, “an atmospheric physicist showed how larger raindrops fall faster because they have a greater volume-to-surface-area ratio and thus a higher terminal velocity than smaller raindrops.
“Because of this, the larger drops catch up to the smaller drops and coalesce with them. The raindrops then grow in size, causing the size distribution to get bigger.”
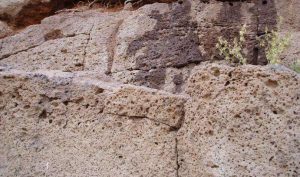
At the time, Sahagian was studying the vesicles, or air bubbles, that become suspended in the hardened flows of basaltic lava, a highly fluid form of molten rock spewed by volcanoes. The vesicles form and are trapped in the top and bottom layers of the lava flow; the middle layer, the last to solidify, remains bubble-free.
The physicist’s lecture led to a Eureka moment for Sahagian.
“I turned the heavens upside-down, so to speak,” he recalls. “I imagined the larger lava bubbles flowing upwards, like the bubbles in champagne or soda, and catching up to the smaller bubbles and then coalescing and rising faster still.”
The top and bottom layers of the lava, Sahagian assumed, should contain roughly the same sizes of bubbles and the same distribution of bubble sizes. He did some mathematical calculations and wrote a model describing the rise, growth and coalescence of bubbles in a lava flow.
“But then one day I realized that the size distribution of the bubbles at the top of the flow should differ from the distribution at the bottom even though the lava comes from the same volcanic magma,” he said. “That’s because at the top, the bubbles are subjected only to atmospheric pressure, while at the bottom, they’re subjected to atmospheric pressure as well as to the hydrostatic pressure from the weight of the lava above.”
Thus, Sahagian reasoned, by calculating the ratio between modal bubble size in the top and bottom layers of the lava, and relating this to the thickness and the age of the lava flow, he could determine the atmospheric pressure that prevailed when the lava emplaced, or hardened into its final position. (The modal size is the size range with the greatest population of bubbles.)
“In other words, the ratios of the volumes of the bubbles should be the same as the ratio of the pressures. If we can measure the bubble volumes and the thickness of the lava, we can solve for atmospheric pressure.”
And given that atmospheric pressure declines as a function of increasing elevation, Sahagian further deduced that it should be possible to determine at what elevation the lava emplaced.
Several years later, Sahagian, by this time a faculty member at Ohio State University, headed to Hawaii to test the formula in basaltic lava flows that had hardened during the 1959 eruption of Mauna Loa volcano.
“When in doubt,” he says, “go to Hawaii.”
Sahagian and his student, Joe Maus, measured bubble sizes and distribution in samples taken from the base of Mauna Loa at sea level and from its summit at 12,000 feet elevation. To avoid skewed results, they sampled only simply emplaced, well-preserved and exposed lava flows that had not been altered—through inflation or drainage—after the upper and lower parts of the flows had solidified.
“We did a lot of scouting around before we found the right kind of flows,” Sahagian said. “We wanted to make sure that the vesicularity we measured was truly a function of stratigraphic position in the flow.”
The researchers calculated the ratio between average bubble size in the top and bottom layers of the lava at the base of Mauna Loa and then determined the same ratio for the lava at the volcano’s summit. The difference between the two ratios was significant, and it corresponded roughly to the difference in atmospheric pressure between the summit and base of Mauna Loa. Sahagian and Maus reported their results in Nature magazine in 1994 in an article titled “Basalt Vesicularity as a Measure of Atmospheric Pressure and Paleoelevation.”
“If atmospheric sea-level pressure is known (or assumed),” they wrote, “vesicle size distributions in basalt flows can thus be used as an indicator of the paleoelevation of emplacement. Analysis of the vesicle size distribution of basalt samples collected from the summit and base of Mauna Loa volcano in Hawaii [show] that the technique provides estimates of ambient pressure that provided estimates of elevation with a resolution of about 400 meters.”
“We were excited about this,” says Sahagian. “There weren’t really any good geologic paleoaltimeters to tell you how high a land feature was unless it was at sea level. We could measure water depth better than we could measure elevation.
“But now I had made a paleoaltimeter out of a trivial mathematical formula, and it worked.”
Sahagian next took his new technique to the Colorado Plateau, which covers large portions of Utah, Colorado, Arizona and New Mexico. Scientists using different methods to measure the plateau’s geologically recent rise in elevation had arrived at seemingly contradictory conclusions as to when—and thus why—the uplift was occurring.
“We tried to settle a dispute between those who said this was a recent uplift and those who said it was ancient. It turned out that both groups were right. The plateau has been uplifting for at least 30 million years but it’s been uplifting faster in the last five to ten million years than it was before.”
Most recently, Sahagian has traveled to the Hangay Mountains of central Mongolia to take on another geological puzzle: How did a relatively high region—the Hangay is a plateau with peaks reaching 13,000 feet in elevation—occur in a continental interior where elevations are usually low? Also, the Hangay are located near major rift zones that are stretching and that might be expected to have a flattening effect on the topography.
Sahagian and his collaborator, Alex Proussevitch of the University of New Hampshire and formerly of the Siberian Academy of Sciences in Novosibirsk, Russia, are part of an interdisciplinary team of two dozen researchers that has spent seven years studying the Hangay with a grant from the National Science Foundation. The team includes Lehigh faculty members Peter Zeitler, a geochronologist, Anne Meltzer, a seismologist, and Bruce Idleman, a senior research scientist. The researchers hope to shed light on the geologic history of the Earth and on the connections linking continental deformation, the development of topography and global climate.
In Mongolia, the first order of business for Sahagian and Proussevitch and their colleagues was to search for samples of well-exposed, unaltered lava whose thickness could be accurately measured. As the Hangay Mountains are a region of rugged topography with few roads and little if any infrastructure, the group considered itself fortunate to find a Russian-speaking driver with an all-terrain van.
“We did a lot of scouting around and collected samples,” says Sahagian. “We tried to make sure these lava sites had good exposure and that we could see the top and the bottom of a lava flow. We went all over the Hangay Plateau and the surrounding areas, including the Gobi Desert, where there were lava flows as well.”
The group collected samples drilling 1-inch-diameter cores. The specimens were dated by Zeitler and his students in Lehigh’s Geochronology Lab and found to range in age from 100,000 years to 3-4 million years to 9.5 million years.
“We were fortunate to get a good distribution of ages,” says Sahagian.
The researchers next used high-resolution computed x-ray tomography scanning to measure bubble sizes and distributions in the top and bottom layers of each lava specimen. They then determined the ratio of average vesicle sizes between the layers and, subsequently, the atmospheric pressure at the time of emplacement.
The group reported its results last year in an article in the Journal of Geology titled “Uplift of Central Mongola Recorded in Vesicular Basalts.” Its main conclusion: the Hangay Mountains have risen in elevation by approximately 1 kilometer, plus or minus a few hundred meters, in the last 10 million years. When this uplift occurred, and whether it happened all at once, gradually or in fits and starts, has yet to be determined.
Sahagian says that much work remains to be done in the Hangay Mountains.
“This is one of our first results. Many different hypotheses have been suggested as to why the Hangay region is high and why it is uplifting. We’re hoping to test these and develop a hypothesis of our own. We’re waiting for the results of seismic work that will tell us more about the deep structure of the mantle and upper and lower lithosphere.
“But as far as our basaltic vesicularity work is concerned, our result is robust. One kilometer in 10 million years is not an abnormal rate of uplift. It’s very consistent with what others are finding. How do we interpret that result? That’s the bigger picture, and it still has to be resolved.”
Reference:
D. Sahagian et al. Uplift of Central Mongolia Recorded in Vesicular Basalts, The Journal of Geology (2016). DOI: 10.1086/686272
Note: The above post is reprinted from materials provided by Lehigh University.


