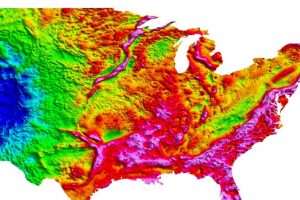
Credit: USGS
When Doug Wiens approached Minnesota farmers to ask permission to install a seismometer on their land, he often got a puzzled look. “You could tell they were thinking ‘Why are you putting a seismometer here?,’ ” said Wiens, professor of earth and planetary sciences in Arts & Sciences at Washington University in St. Louis. “‘We don’t have earthquakes and we don’t have volcanoes. Do you know something we don’t?’ ”
Actually, he did. Deep beneath the fertile flat farmland, there is a huge scar in the Earth called the Midcontinent Rift. This ancient and hidden feature bears silent witness to a time when the core of what would become North America nearly ripped apart. If the U-shaped rip had gone to completion, the land between its arms—including at least half of what is now called the Midwest—would have pulled away from North America, leaving a great ocean behind.
Weisen Shen, a postdoctoral research associate with Wiens, will be presenting seismic images of the rift at the annual meeting of the Geological Society of America (GSA) Sept. 25-28. The images were made by analyzing data from Earthscope, a National Science Foundation (NSF) program that deployed thousands of seismic instruments across America in the past 10 years.
What is that thing?
The Midcontinent Rift was discovered by geophysicists who noticed that gravity was stronger in some parts of the upper Midwest than in others. In the 1950s and 1960s, they mapped the gravity and magnetic anomalies with airborne sensors. Shen is contributing to a session at the GSA dedicated to Bill Heinze, a geophysicist who helped discover and map the Midcontinent Rift.
But understanding of the rift then stalled until 2003, when the NSF funded Earthscope, a program whose mission is to use North America as a natural laboratory to gain insight into how the Earth operates.
As part of Earthscope, the Incorporated Research Institutions for Seismology (IRIS) installed a network of 400 seismometers, called the USArray, that rolled across the United States from west to east, gathering data at each location for two years before moving on. USArray was installed on the West Coast beginning in 2004, and had advanced to the Midwest by 2010.
Earthscope also made available a pool of seismometers, called the flexible array, for more focused field experiments. A consortium of universities, including Washington University in St. Louis, installed 83 of these stations along and across the rift in 2011, creating a dense array called SPREE.
A telescope looking down
Seismologists had never before been able to blanket the landscape with seismometers in this way, and so the USArray has stimulated many innovations in the manipulation of the seismic data to extract information about Earth’s crust and upper mantle.
Seismic interpretation is a thorny version of what is called an inverse problem. If the Earth’s interior were of uniform composition, seismic waves would travel in straight lines. But instead, underground structures or differences in temperature and density refract and reflect them. The problem is to figure out mathematically which obstructions could have produced the wave arrivals that the seismometers recorded.
It’s a bit like trying to figure out the shape of an island in a pond by throwing a pebble into the lake and recording the ripples arriving at the shore.
The data wizard on the Washington University team is Shen, who has devised new techniques for combining many types of seismological data to create sharper images of Earth’s interior.
The farmers in Minnesota have a point when they wonder what an “earthquake sensor” could detect in an area where there are no earthquakes. The answer is that the seismometers record distant earthquakes, such as those on the Pacific Ring of Fire on the opposite side of the planet, and ambient noise, caused by activity such as powerful storms slamming into the Jersey Shore.
Shen has seasoned the mix with several other measurements that can be extracted from the seismic record as well. By inverting all of these data functions simultaneously within a Bayesian statistical framework, he is able to obtain much clearer images of Earth’s interior than one type of data alone would produce, together with estimates of the probability that the images are correct.
Not just a scar, a keloid scar
What have the scientists learned about the rift?
“When you pull apart a continent, like a piece of taffy, it starts to stretch and to thin,” said Michael Wysession, professor of earth and planetary sciences and a member of the SPREE team. “And as it sags, the dip fills with low-density sediment.
“So if you go over a rift with a gravity sensor, you expect to find a negative gravity anomaly. Mass should be missing. But that’s not what happened with the Midcontinent Rift. Instead of being thinner than the surrounding crust, it is thicker.
“We know that lava comes out at rifts,” Wysession said. “The East African rift zone, for example, includes a number of active and dormant volcanoes, such as Mount Kilimanjaro. But the Midcontinent Rift was flooded with lava, and as it sank under the weight of the cooling basaltic rock, even more lava flowed into the depression.
“A huge volume of lava erupted here,” Wysession said. “It was perhaps the largest outflowing of lava in our planet’s history. And then, after the eruptions ended, the area was compressed by mountain building event to its east, thickening the scar by squeezing it horizontally.
Shen published images of the rift made with USArray data in the Journal of Geophysical Research 2013. But at that time, he had only sparse coverage in the rift’s vicinity. At the 2016 GSA meeting he will present images made with both USArray and SPREE data (especially many more “receiver functions,” a type of seismic data that is particularly sensitive to seismic boundaries) that show what lies beneath the rift more clearly.
Miles beneath the Earth’s surface, there is a seismic boundary called the Mohorovičić discontinuity, or Moho. At the Moho, seismic waves hit higher density material and suddenly accelerate. But beneath the rift, Shen said, the Moho is blurred rather than sharp. “Its structure has been destroyed,” he said.
He also sees evidence of something called magmatic underplating. “We think magma might have trapped, or stalled out, at the Moho or within the crust during its rise to the surface,” he said. This might explain why the Moho is so disrupted, although Shen can think of alternative explanations and expects there to be lively discussions at the GSA.
He compares images of the Midcontinent Rift made with the SPREE array to images of the Rio Grande rift made with a similar seismic array called La Ristra. The La Ristra images show that the Rio Grande rift is thinner than the surrounding crust, not thicker. The Moho is clear and rises rather than sinks under the rift.
“I think we’re looking at different stages of rifting,” Shen said. The Rio Grande Rift is still active, still opening, but the Midcontinent Rift is already dead and has been squeezed shut.
Wiens commented that the tremendous outpouring of magma at the Midcontinent Rift might also have disrupted its structure, making it look different from other rifts.
“My goal,” Shen said, “is to provide basic seismic models of interesting tectonic regions like this one for geologists, geochemists and scientists from other disciplines to use—to help them interpret their results and also help the public to better understand the story of the land they live on.”
Rural Minnesota is already onboard. “Some landowners were quite interested in what we were doing,” Wiens said. “We got into one or two small town newspapers. ‘So-and-so now has a seismometer on his farm,’ the headline would read.”
Reference:
Weisen Shen et al. A 3-D model of the crust and uppermost mantle beneath the Central and Western US by joint inversion of receiver functions and surface wave dispersion, Journal of Geophysical Research: Solid Earth (2013). DOI: 10.1029/2012JB009602
Note: The above post is reprinted from materials provided by Washington University in St. Louis.


