The bottom of the ocean just keeps getting better. Or at least more interesting to look at.
In an ongoing project, mappers at Lamont-Doherty Earth Observatory have been gathering data from hundreds of research cruises and turning it all into accessible maps of the ocean floor with resolutions down to 25 meters.
You can see some of the results here, at a mapping site that allows scientists—and you—to zero in on a particular location, zoom in and download topographical maps of the ocean floor. The Lamont data has also contributed to the latest version of Google ocean map, which now offers its own more closely resolved view of the ocean floor globally. (You can take a quick tour of the updated Google map here.)
“I love looking at everything,” said Vicki Ferrini, a scientist at Lamont who oversees the team that synthesizes the data and creates the maps. Ferrini may have absorbed more data about the ocean floor than anyone; a self-professed map and data geek, she says she has her own map of the oceans in her head.
“I really like these sinuous channels in the deep sea, they’re very cool to me. … There [are] clearly concentrated areas of energy that are able to scour these river-like features through the seafloor. And the [mid-ocean] ridges are all pretty cool.”
The new data from Lamont covers about 8 percent of the ocean floor, a fraction of the oceans, but a sizable piece overall of the earth’s surface. The data mostly comes as a byproduct of scientific expeditions that send research vessels criss-crossing the seas, explained Suzanne Carbotte, a professor of marine geology and geophysics at Lamont. The cruises may not be focused on ocean topography at all; but as the ships sail, they keep their measuring instruments humming and collect sonar data.
The sonar sends a pulse of sound down through the water column, and uses the speed of the sound’s return to calculate depth. Data from U.S. expeditions is archived by the National Oceanic and Atmospheric Administration. Lamont processes that data, gathers more from scientists around the world, and turns it into maps.
The Google ocean map, covering the entire ocean floor, relies mostly on data collected by satellite that is curated by the Scripps Institution of Oceanography, in partnership with NOAA, the U.S. Navy and the National Geospatial Intelligence Agency, with contributions from the Japan Agency for Marine-Earth Science and Technology and Australia Geosciences-AGSO. It also incorporates the more precise data from Lamont. (A video produced by Scripps at this site offers an interesting global tour of mid-ocean ridges.)
The satellite data details small changes in sea surface height which, through gravity, reflect the underlying topography of the sea floor. The latest version of the Scripps-NOAA ocean map offers a resolution of roughly 500 meters—an improvement over the earlier, 1 kilometer resolution. That means one data point for every 500-meter-square grid of the seafloor. Even that rough picture is valuable, Carbotte said. “The coarse data does a beautiful job revealing the detailed boundaries of earth’s tectonic plates and other large-scale seafloor structures, and the map covers the entire ocean,” she said.
Those measurements allowed researchers to discover a new “microplate” in the Indian Ocean—a remnant from the crustal shifts that sent the Indian subcontinent crashing into Eurasia, creating (and still forming) the Himalaya mountains. Researchers studying that plate have come up with a more precise date for when that collision began, 47.3 million years ago.
But the finer resolution mapping processed by Lamont opens up other avenues for scientists. “It allows you to study the active modern processes that shape the seafloor,” Carbotte said, like earthquakes and undersea landslides that can flush sediments across long distances.
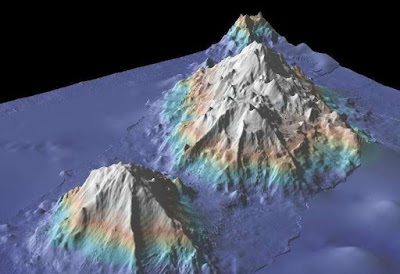
Scientists can dive into the maps and data and use various tools at the Marine Geoscience Data System site, created to provide free public access to marine geoscience data. Lamont-Doherty serves as the host laboratory; funding comes from the National Science Foundation, and from Google. The mapping page, here, has a “masking” tool (at the upper right) that allows the viewer to see the tracks of research vessels and contrast the sonar data results with the broader ocean map. Some of the more interesting features include the deep ocean trenches, the zigs and zags of fault lines where earth’s crust is forming and deforming, and massive oceanic plateaus and undersea volcanoes that reflect volcanic outpourings away from the mid-ocean ridges. There are “fabulous canyons that carve the continental margins and channels that extend out into the deeper oceans,” Carbotte said.
Scientists expect to see plenty of activity along the edges of tectonic plates including at the mid-oceanic ridges, where new crust is formed from upwelling and melting of the mantle below, and at subduction zones, where enormous slabs of earth’s crust collide and one plate sinks beneath another. But the new mapping has helped scientists see that there’s also geologic activity in the broad interior spaces of the oceanic plates, Carbotte says, such as fields of volcanic seamounts of many sizes, and far-reaching channels of sediments transported into the deep ocean.
The finer resolution helps scientists study how the crust forms at mid-ocean ridges and then deforms before descending into earth’s mantle, bending and faulting along subduction zones. “With the new detailed data from many subduction zones, we can conduct comparative studies of this bend faulting and relationships to the rate of subduction, the age of the plate and sediment cover, and [that] helps us in … understanding the subduction process,” Carbotte says.
The process of mapping the ocean floor in detail continues; there’s enough data already available to keep Carbotte, Ferrini and the staff busy for a long time. Covering just 8 percent of the oceans has involved hundreds of cruises over millions of miles. The oceans are so large that a thorough mapping would involve an estimated 125 to 200 ship-years of cruises (mapping on land, even on distant planets, can happen far more quickly using satellites). The Lamont crew updates their maps every six months.
Lamont has been collecting measurements and other data about the oceans for more than half a century. The first comprehensive map of the global ocean floor was created by Lamont oceanographers Marie Tharp and Bruce Heezen and published in 1977. In the 1980s, another Lamont scientist, William Haxby, used satellite measurements to compose the first “gravity field” map of the oceans. Now, the same database contributing to Google Earth feeds Lamont’s EarthObserver, a global scientific mapping application for iPads and other mobile devices.
When we step onto an airliner, “We have map displays at our seats that show the flight paths, and it used to be the ocean was just a single flat, featureless blue,” Carbotte said. “Now they make use of these new ocean floor maps, so when you’re flying across the middle of the Atlantic, you can see the mid-ocean ridge right from your airplane seat.”
Note: The above post is reprinted from materials provided by Columbia University.


