We live on an ever-changing planet. Volcanoes emerge from the oceans; landslides transport millions of tonnes of material down hills and mountains causing billions of pounds of damage; coastlines and glaciers retreat at almost visible rates. But can we do anything about it? Lee Jones says we can.
Geomatics is the science of measuring, storing and processing information about the Earth that is accurate in both space and time. It uses a variety of specialised equipment, including Terrestrial Light Detection and Ranging (LiDAR) Scanners (TLS) and Global Navigation Satellite Systems (GNSS) to produce images, maps and 3D models of these rapidly-changing environments that are geo-referenced – accurately positioned in physical space.
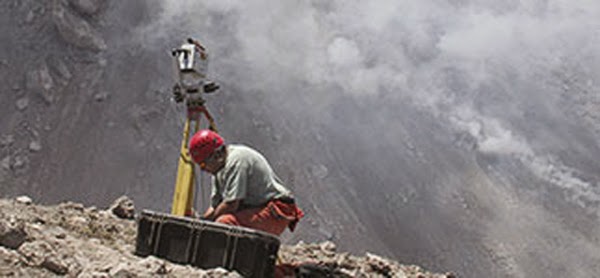
The British Geological Survey (BGS) has been using geomatic techniques, both in the UK and overseas, since 2000. Applications have been many and varied. Scientists have monitored the actively-growing volcanic lava dome of the Soufriere Hills Volcano, on the Caribbean island of Montserrat. They have mapped and modelled several UK landslide locations, both inland and on the coast
They have tracked eroding coastlines on England’s eastern and southern coasts, and carried out rock stability analysis in places from Brotton in North Yorshire to the Rock of Gibraltar. They have even been involved with geo-conservation – caring for sites which make a special contribution to our Earth heritage – at Hutton’s Unconformity* at Siccar Point in Berwickshire and other sites across the UK.
Monitoring the shifting coastline
BGS has a field laboratory site on the Holderness coast, at Aldbrough in North Yorkshire. The 300m-long site includes a 17m-high section of cliff made up of glacial till, a mixture of clay, sand, gravel and boulders left behind by retreating glaciers during the last ice age. The cliff has been monitored since 2001 and is disappearing at a rate of 3m a year. This erosion is caused by both landslides and the direct action of the sea crashing against it.
Between 2001 and 2013, researchers carried out 19 terrestrial LiDAR surveys on the same section of cliff and beach. Varying weather and tide conditions meant that not all the surveys had the same coverage, but the scans gave us enough information to create 3D terrain models – digital representations of the ground surface without any objects like plants and buildings. We could then model how the ground was changing over time.
In 2012, BGS established a weather station at the site to record rainfall, wind-speed and direction, temperature and atmospheric pressure. Two pairs of 20m-deep boreholes were drilled 10m and 20m back from the cliff edge, which we used to place instruments for measuring changes in slope angle and water pressure. This information helps us model future changes in the cliff that may warn of landslides. Putting instruments in active slopes and retreating coastlines in this way may give us enough forewarning of slope failure or coastal collapse to allow time for evacuation and specialist repairs, potentially saving lives and millions of pounds.
Tracking glaciers’ retreat
BGS also has a field observatory site at Virkisjökull in south-east Iceland, studying the evolution of the glacier and the surrounding landscape, and their responses to regional climate. Repeated, highly detailed surveys monitor how both the glacier and land surface, and the rock and earth beneath, change over time. Cutting-edge technologies, not used in such a combination anywhere else in the world, give us unique insights into how the landscape is formed and how the glacial system responds to climate change. Virkisjökull is retreating quickly, like most glaciers in Iceland. Since 1996, the glacier margin has retreated nearly 500m and it has accelerated over the last five years.
No single location has a view of the entire glacier, so since 2009 we have used different combinations of instruments at different sites to get a picture of its whole surface. The enormity of this task should not be underestimated; transporting over 50kg of surveying kit across the glacial foreland is hard enough, but moving it onto the glacier itself while wearing crampons was extremely treacherous.
In terms of data-storage and processing, these LiDAR scans were massive, with over 300 million points recorded in the 2012 survey alone. The data produced by the laser scan survey were turned into a virtual 3D surface of the glacier and its margin; from this we could create change models from year to year and determine how quickly the glacier is retreating over time.
In 2010 we set up three weather stations and four seismometers to locate and measure the size of the ground movement under and around the glacier. Two years later, we installed six GNSS units on the glaciers of Virkisjökull and Falljökull, with another unit as a permanently recording base-station on stable ground away from the ice, to let us accurately monitor the rate of glacial movement.
This shows us that the top of the glacier, where it drops over the edge of the cliff (the ice-fall), is being pushed forwards by newly-formed ice from the ice-cap that feeds it, by more than 70m a year. However, the front edge of the glacier – its snout – is melting back at a rate of over 10m a year. This is happening even in the winter, telling us the glacier is now in terminal decline.
This type of monitoring has importance far beyond the glacier itself. By finding out how the Earth is changing in a particular place, we can gain insights into much broader trends in the environment. Tracking the glacier’s retreat at Virkisjökull gives us a better understanding of what effect climate change is having on our planet. Monitoring the coast at Aldbrough shows us how our coastlines are reacting to changes in sea levels and weather patterns. When we need to understand the big picture, sometimes it pays to think small.
*This is a rocky promontory where in 1788 James Hutton made one of the fundamental breakthroughs in the history of geology. He realised that rock formations created at different times and by different forces came together here, providing compelling evidence for his theories on the Earth’s age and on the forces that shape it.
Note : The above story is based on materials provided by Planet Earth ” NERC “.


